






TLDR
- Bitcoin trades near $81,641, about 84% below the $150,000 level discussed for next year.
- The weekly chart shows a break above a descending trendline, with RSI near 56.75 and MACD turning positive.
- Glassnode sees support at $80,000 to $81,500 and resistance near $88,000.
- CoinShares sees a possible move beyond $150,000 in a soft-landing case, or $110,000 to $140,000 in a slower case.
- US spot Bitcoin ETFs saw $82.4 million in net outflows on October 16, according to Farside data.
Bitcoin trades near $81,641, still well below its all-time high of about $125,761. The price has found some stability in recent weeks, but analysts say the market needs a clear breakout before $150,000 comes into view.
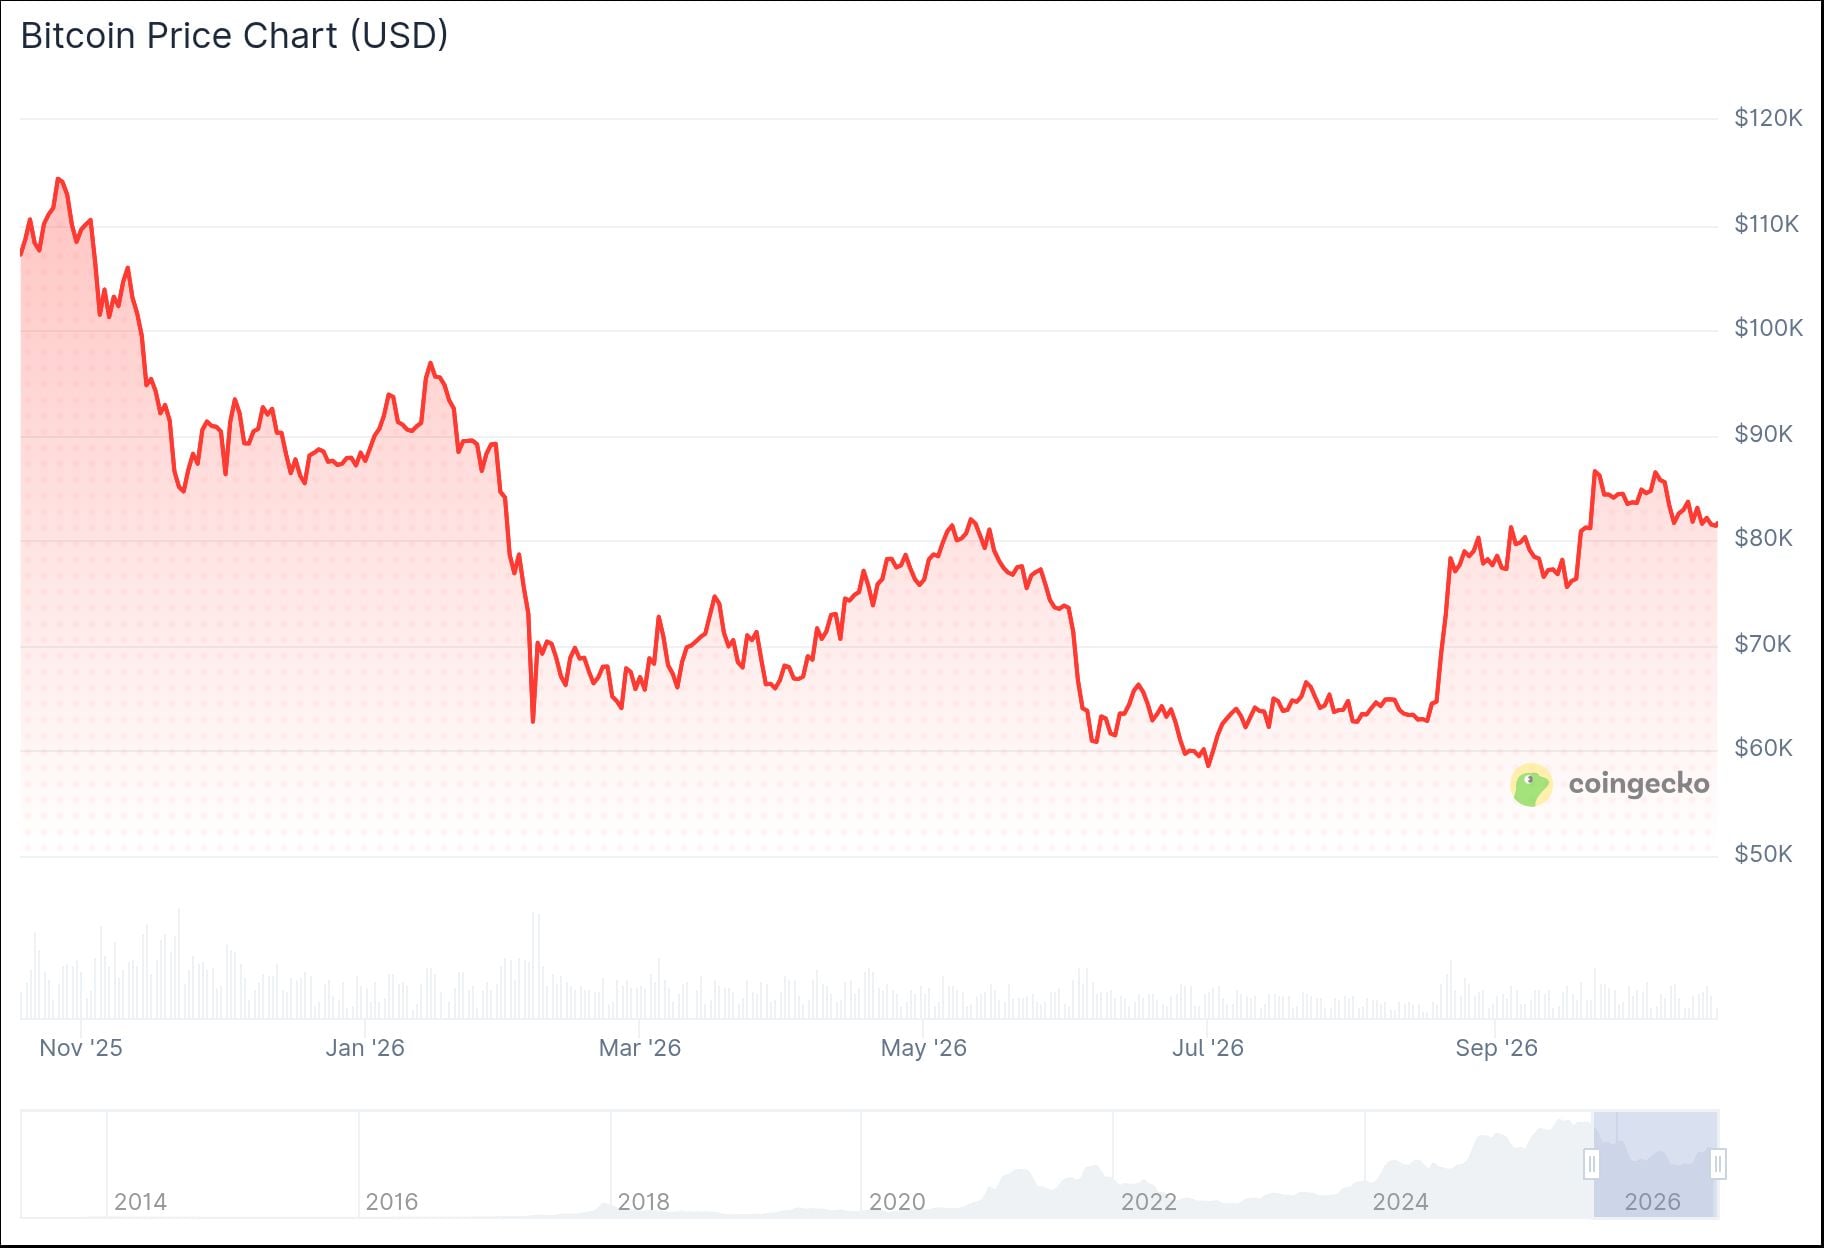
The wider picture is mixed. US spot Bitcoin ETFs have turned into net sellers again, with Glassnode noting about $760 million in outflows since October 7.
Farside data shows a further $82.4 million in net outflows on October 16.
Analyst Willy Woo says bears waiting for a lower bottom are on the wrong side of the trade. He points to capital flows in and out of BTC, which he says bottomed on August 9, 2026.
I personally think bears waiting for a lower bottom are on the wrong side of the trade.
Capital flowing in/out of BTC bottomed August 9th 2026. pic.twitter.com/0Q2FsJ5ZLP
— Willy Woo (@willywoo) October 18, 2026
Weekly Chart Analysis
The TradingView weekly chart shows BTC breaking above a descending trendline drawn from the all-time high. Price then retested the breakout area before moving back toward the low $80,000s.
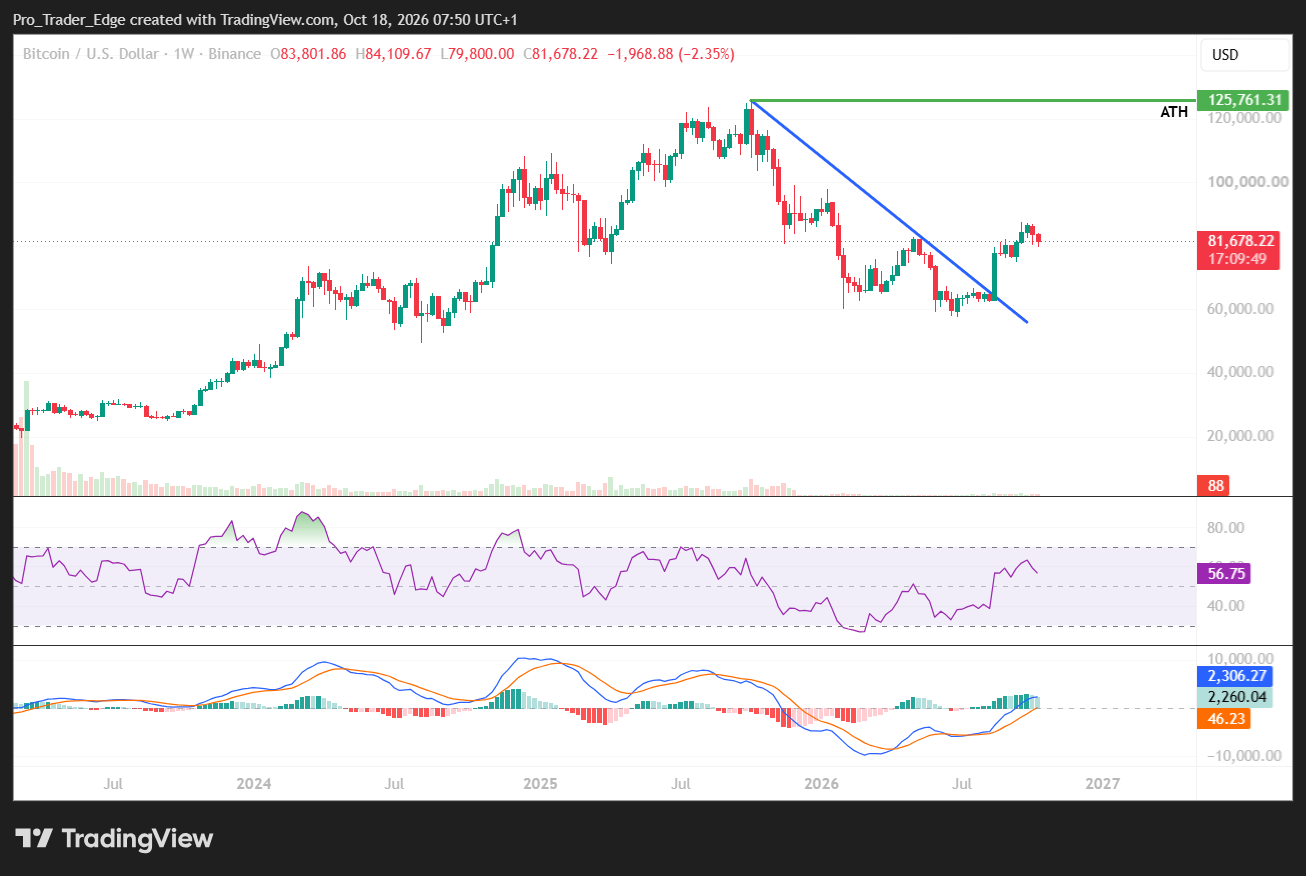
Weekly RSI sits near 56.75, above the neutral 50 line. MACD has crossed into a more positive posture, with green histogram bars building.

Glassnode says Bitcoin faces heavy supply near $88,000, where many buyers from the past two years are near break-even. Nearest support sits between $80,000 and $81,500, where order-book demand overlaps with the US spot ETF cost basis.
Fidelity’s Head of Global Macro also weighed in, according to Bitcoin Magazine. He said a new four-year cycle bull market could be underway based on power law patterns.
NEW: Fidelity's Head of Global Macro says Bitcoin may be entering a new bull market 👀
"A new 4-year cycle bull market could be underway, based on its power law patterns. There doesn’t seem to be a narrative, but then again, bull markets rarely start with one." 🐂 pic.twitter.com/ZNYJKEvHJT
— Bitcoin Magazine (@BitcoinMagazine) October 17, 2026
He added that there does not seem to be a narrative, but bull markets rarely start with one.
Price Scenarios for 2027
CoinShares has outlined a soft-landing scenario in which productivity gains push Bitcoin beyond $150,000. Its more moderate case sees BTC between $110,000 and $140,000.
ARK Invest looks further out. Its 2030 framework projects Bitcoin at about $300,000 in a bear case, $710,000 in a base case and $1.5 million in a bull case.
Our own 2027 framework splits into three cases. The bearish range is $70,000 to $90,000, the base range is $105,000 to $130,000, and the bullish range is $140,000 to $150,000 or more.
A clean break above $88,000 would be the first step. If BTC loses $80,000, Glassnode says the next important area is the True Market Mean near $78,000.
Chart level to watch next: a decisive close above $88,000 on the weekly chart.


