


 Price Prediction: Bullish Metrics Flash Despite Pullback to $117K on PPI Inflation Report")


TLDR
- Bitcoin hit a new all-time high of $124,457 on August 13th before pulling back to around $117,200
- Short-term holders are reducing selloffs and adopting accumulation patterns despite market volatility
- Exchange netflow metrics are approaching bottoms similar to patterns seen before 2017 and 2021 rallies
- Derivatives data shows strong activity with $24.28 million in short liquidations and surge in trading volumes
- Technical indicators like NVT Golden Cross and positive funding rates suggest potential for renewed upward momentum
Bitcoin experienced another milestone this week, reaching a fresh all-time high before entering a phase of consolidation. The world’s largest cryptocurrency by market cap surged to $124,457 on August 13th.
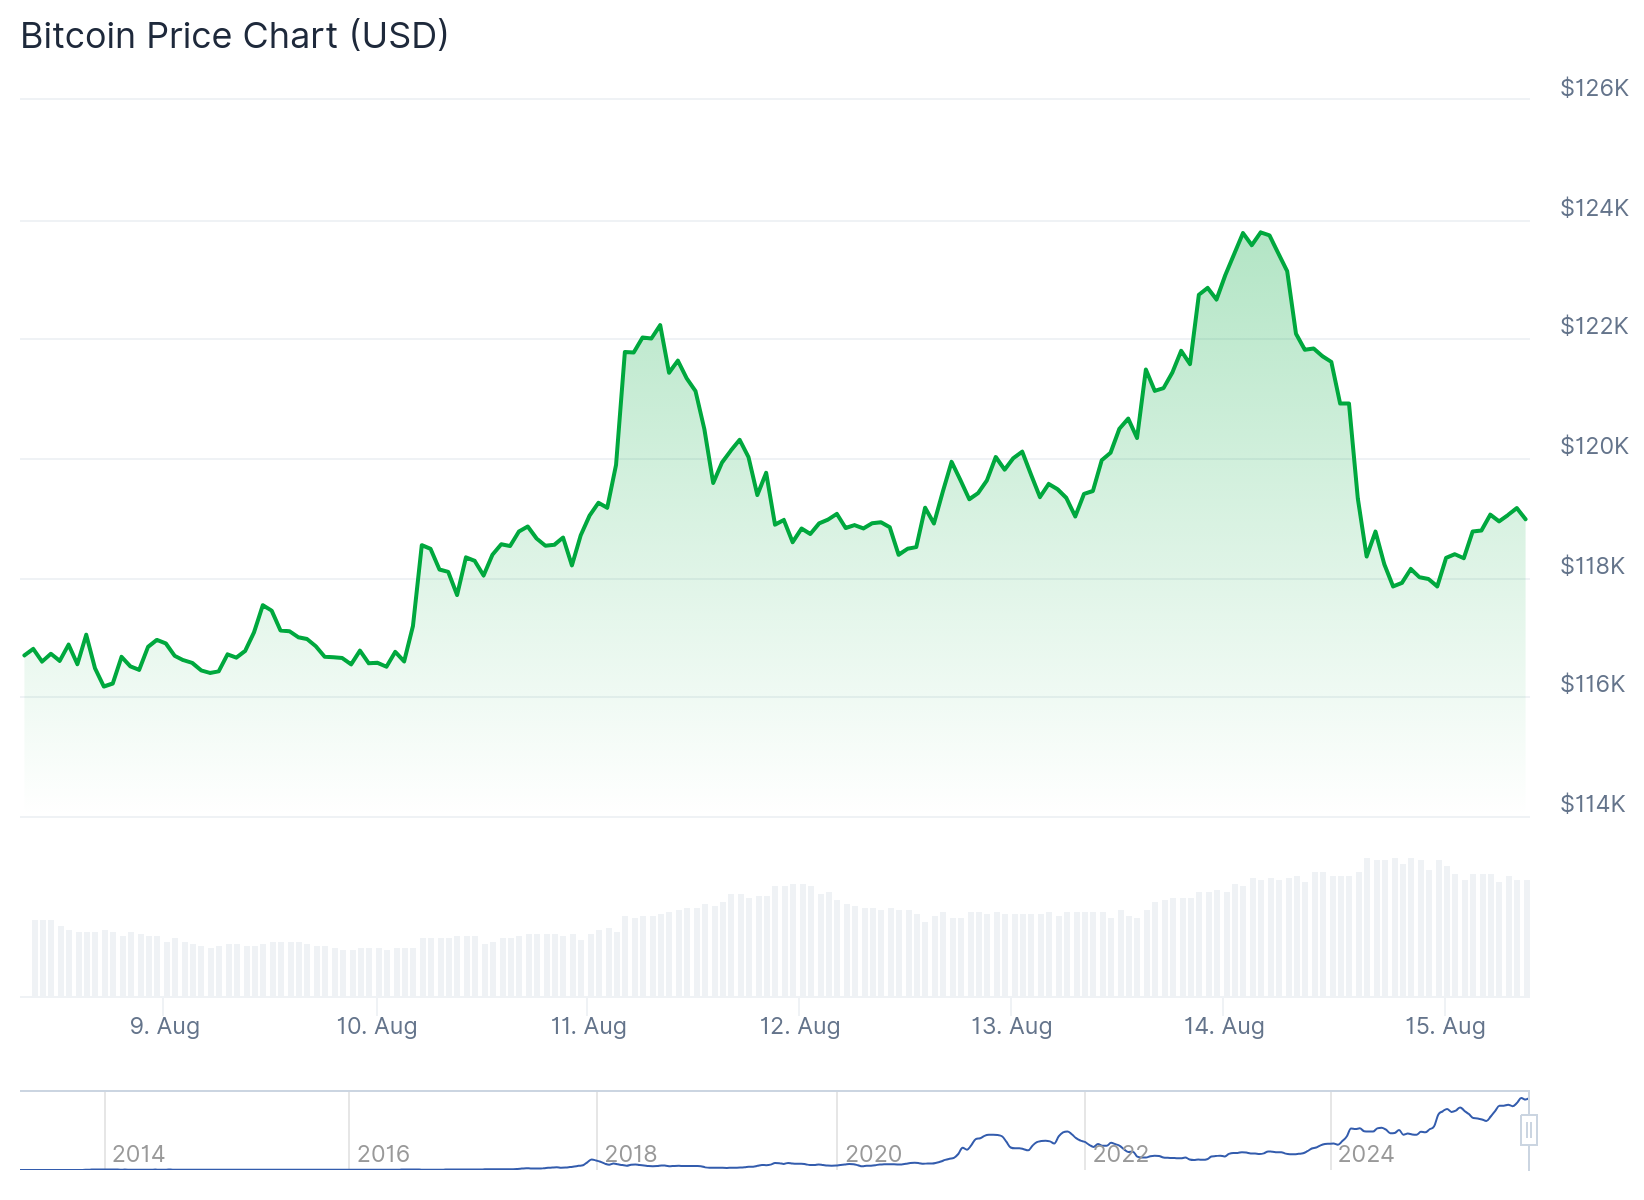
The peak represented the latest chapter in Bitcoin’s ongoing bull run. However, the celebration was short-lived as the price quickly retraced.
As of press time, Bitcoin trades between $119,937 and $120,895. This represents a pullback of roughly 3-4% from the recent peak.
Despite the retreat from highs, multiple on-chain indicators paint a picture of underlying strength. Exchange netflow data has been particularly telling during this period.
Since early August, Bitcoin’s exchange netflow metric has approached levels historically associated with major rally beginnings. These patterns mirror what occurred before the explosive 2017 and 2021 bull markets.
The current netflow readings suggest reduced selling pressure from long-term holders. This dynamic typically creates supply constraints that can fuel upward price momentum.
Short-Term Holders Show Conviction
One of the most encouraging developments has been the behavior of short-term holders. These investors, defined as those holding Bitcoin for 155 days or less, have shifted their approach.

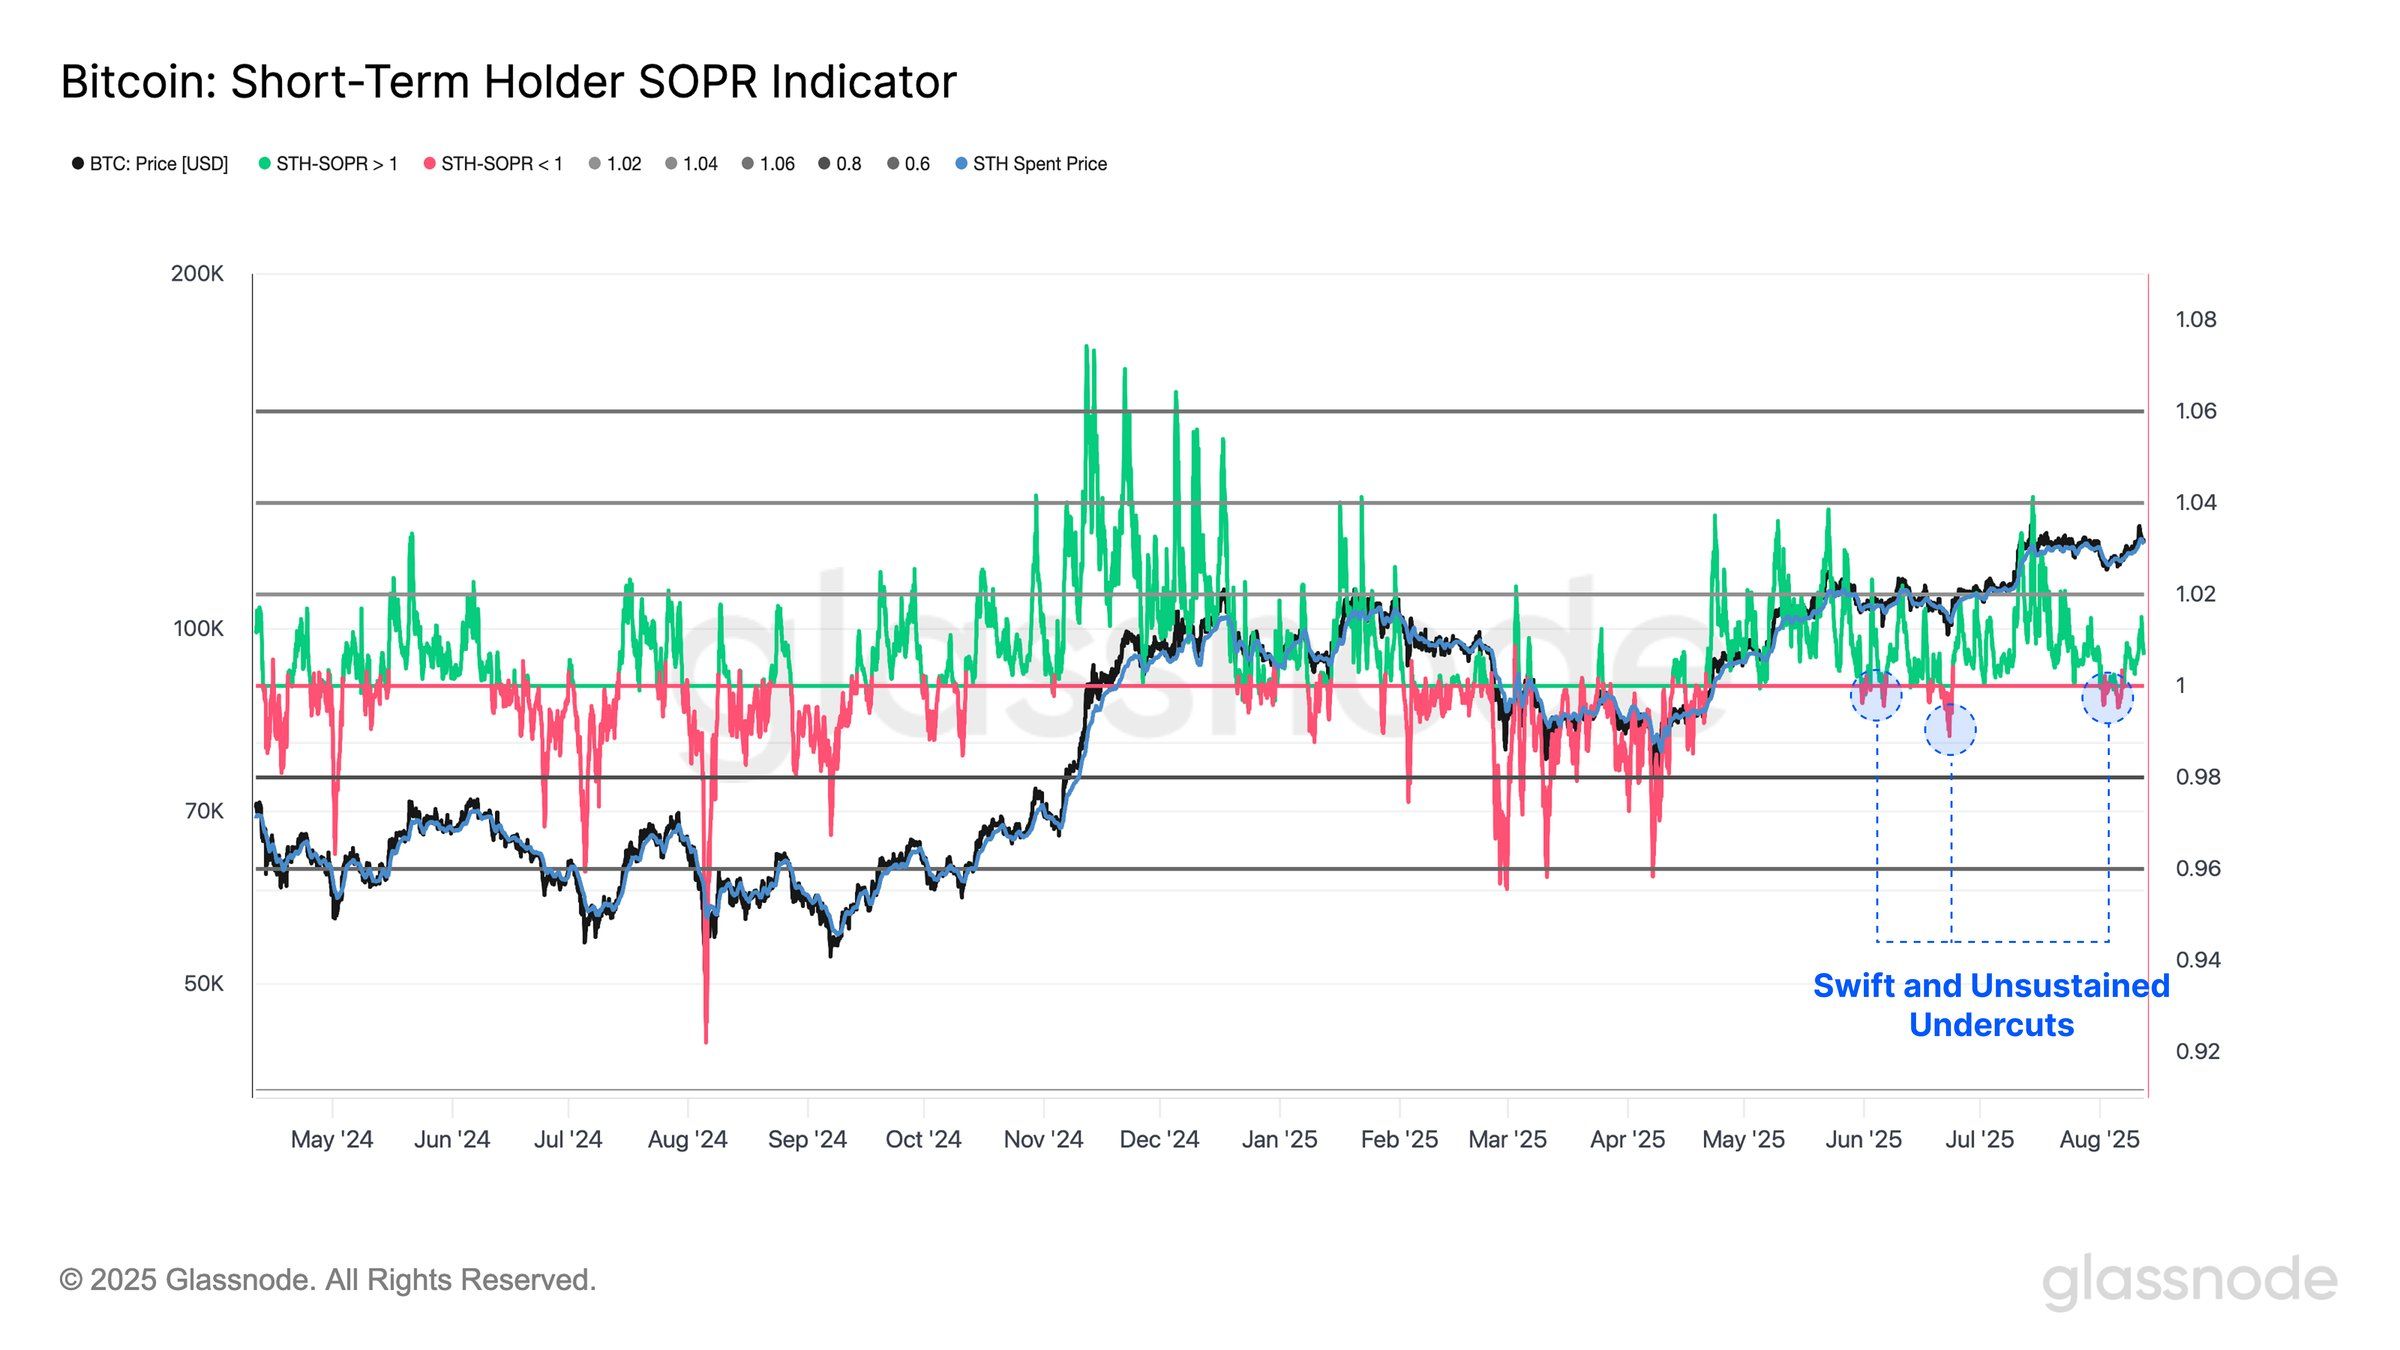
Rather than taking profits during the recent volatility, short-term holders have reduced their selloffs. The STH Spent Output Profit Ratio briefly dipped below the neutral line but has since rebounded above one.
This metric measures whether coins moved by short-term holders are sold at a profit or loss. Values above one indicate profitable sales and strong market sentiment.
The shift is particularly meaningful because short-term holders typically drive immediate price action. Their cost bases often sit close to current market prices, making them sensitive to price swings.
Their decision to hold rather than sell during recent volatility demonstrates market conviction. This behavior can help stabilize prices and support further upward moves.
Derivatives Market Shows Strength
The derivatives market has provided additional bullish signals. Over the past 24 hours, Bitcoin saw $24.28 million in short liquidations compared to $17.16 million in long liquidations.

Trading volume in derivatives surged 65.37% to $149.47 billion. Open Interest climbed 4.14% to $83.76 billion during the same period.
Options activity was particularly robust. Options volume jumped 127.92% to $9.43 billion while Options Open Interest gained 5.19% to $57.15 billion.
The taker-buy/sell ratio reached a monthly high of 1.16. This metric measures the balance between market buy and sell orders on futures contracts.
A reading above one indicates more aggressive buying than selling. The current level shows buyers are actively absorbing available supply in the derivatives market.
Bitcoin’s OI-weighted funding rate held at 0.0137% at press time. Positive funding rates indicate leveraged traders are willing to pay premiums to maintain long positions.
This sustained positive funding suggests healthy bullish sentiment without excessive leverage that might trigger corrections.
Bitcoin Price Prediction
The NVT Golden Cross stood at 0.2709 after declining 53.92%. This sharp drop often aligns with market bottoms that precede strong rallies.
The indicator measures Bitcoin’s valuation relative to transaction activity. The current reading suggests potential undervaluation of the network compared to market capitalization.
Historical patterns show similar compressions in this metric have preceded major upward moves. The rapid decline reinforces the probability of renewed bullish activity.
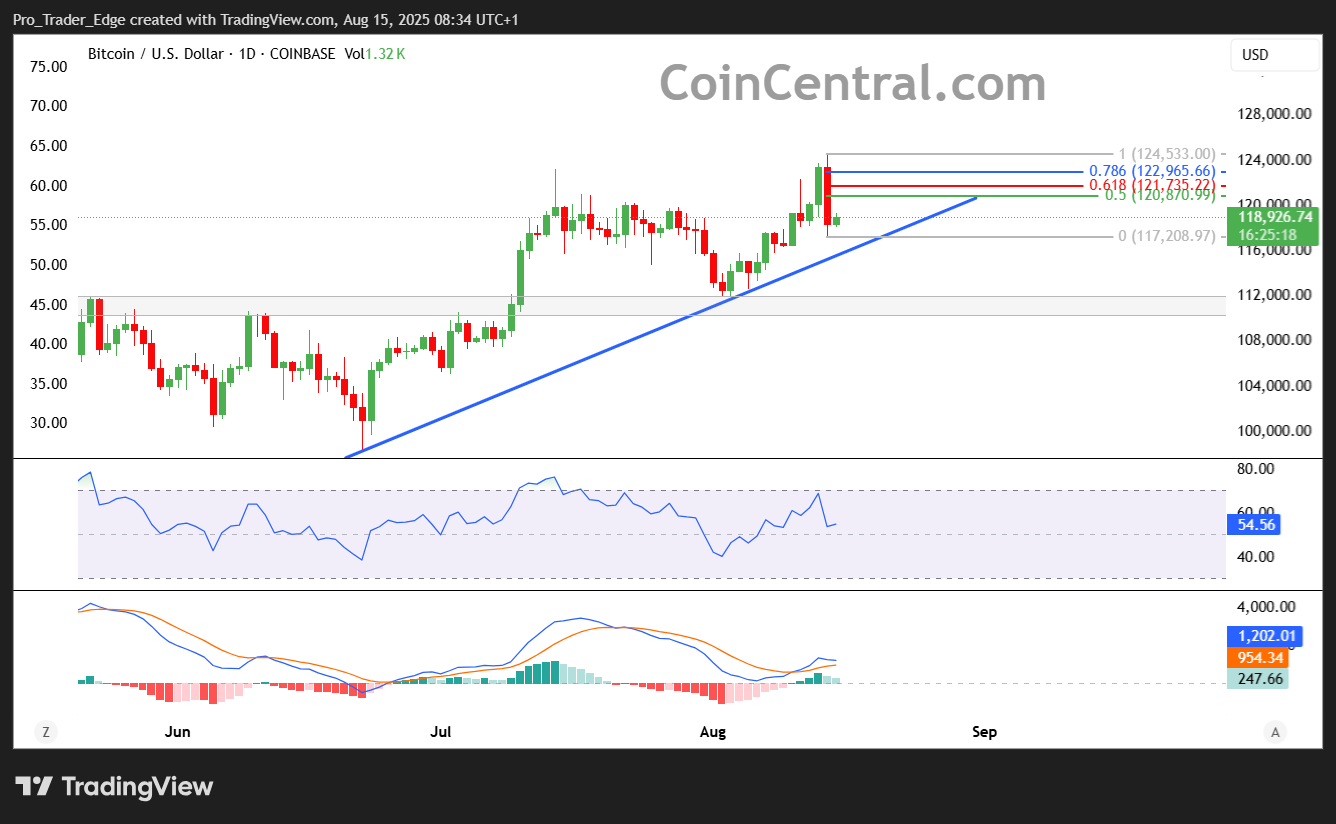
Market participants are now watching for a potential retest of the $122,000 level. A break above $122,190 could trigger a move back toward the all-time high of $124,457.
However, increased volatility could lead to a test of support around $115,892. The derivatives data and on-chain metrics currently favor the upside scenario.


