


TLDR
- SUI rose nearly 4% after being selected as a launch partner for Google’s new Agentic Payments Protocol
- Trading volume surged to 33.14 million during the breakout, nearly four times the 24-hour average
- Bollinger Bands have reached their tightest compression in SUI’s history, matching levels seen before previous major rallies
- Technical analysis suggests potential for 150-200% price increase based on historical patterns
- SUI previously rallied 253% in early 2024 and 404% in late 2024 after similar technical setups
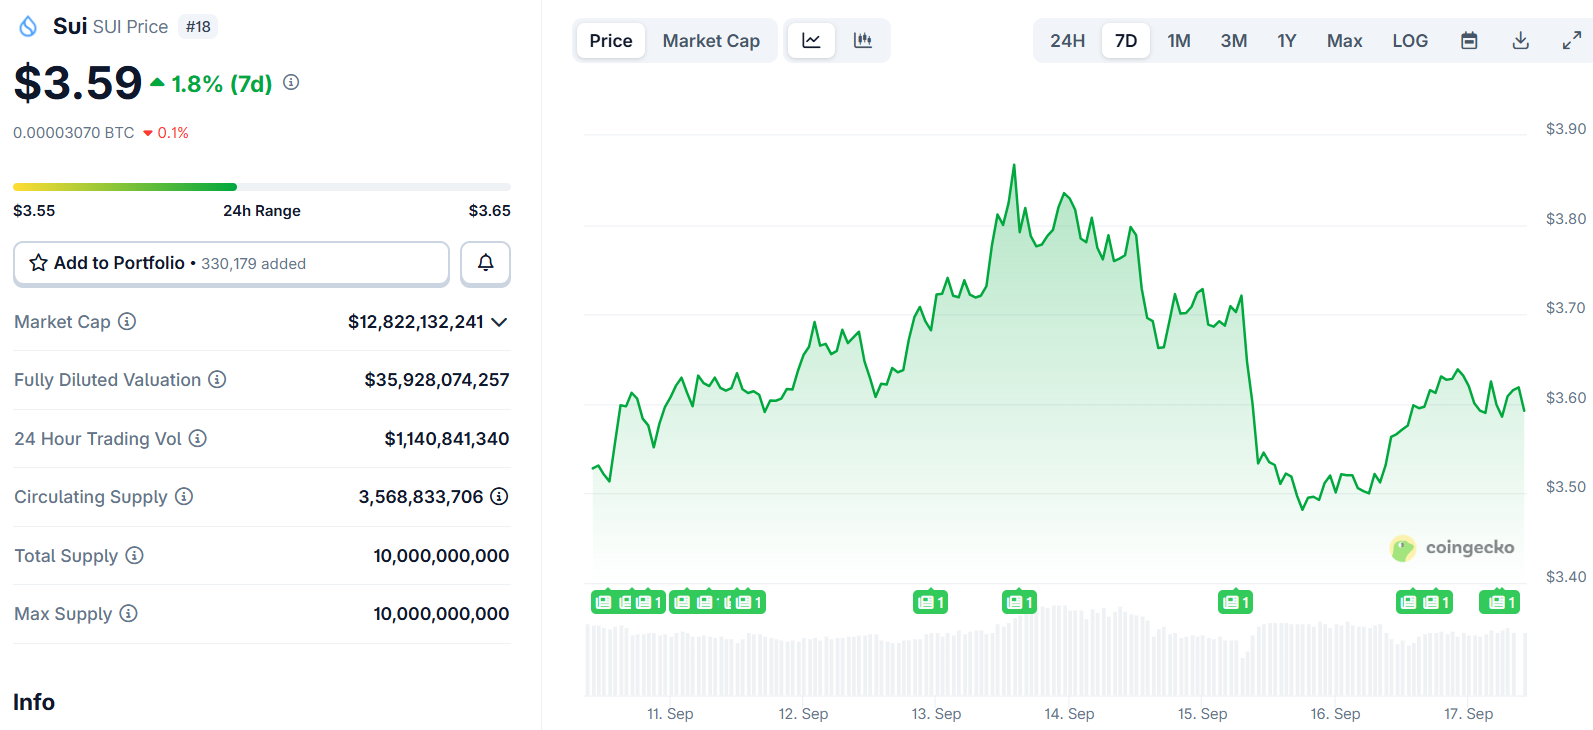
SUI jumped nearly 4% over the past 24 hours following news that Google selected the blockchain as a launch partner for its new Agentic Payments Protocol. The token moved from $3.509 to $3.622, marking a 3.22% gain that outpaced the broader crypto market.
Google’s Agentic Payments Protocol represents a new standard designed to enable AI agents to conduct financial transactions on behalf of users. The protocol aims to bridge smart contracts with real-world payment systems and machine autonomy.
💥 JUST IN: @GOOGLE PARTNERS WITH @SUINETWORK AND @WALRUSPROTOCOL TO LAUNCH ITS AGENTIC PAYMENTS PROTOCOL!
GOOGLE × $SUI + $WAL = AI PAYMENTS AT SCALE 🌐 pic.twitter.com/ZcT00jb4ND
— Matteo.sui (@matteodotsui) September 16, 2025
Trading activity increased dramatically during the breakout. Volume surged to 33.14 million, nearly four times the 24-hour average of 8.73 million.
The price action showed institutional interest. Higher lows and steady bids above $3.50 suggested possible accumulation by larger investors.
During intraday trading, SUI climbed from $3.60 to $3.65 before pulling back to $3.57. The token then settled at $3.60, showing minor weakness in that specific move.
Buyers later reclaimed the $3.61-$3.65 range before volume decreased. This pattern indicated some profit-taking activity.

Technical Analysis Points to Historical Pattern
The Google partnership announcement comes as technical indicators suggest SUI may be preparing for a larger move. Market analyst CryptoBullet identified that Bollinger Bands have reached their tightest compression in SUI’s trading history.
$SUI 1W chart | Bollinger Bands
Bollinger Bands are the tightest EVER in #Sui’s history!
Something is cooking 😏 📈
Prior two times when the BBW indicator hit the 63 level $SUI had massive pumps:
+253% in December 2023 – March 2024
+404% in September 2024 – December 2024… pic.twitter.com/9pLIKecku7— CryptoBullet (@CryptoBullet1) September 16, 2025
Bollinger Bands measure price volatility. When they compress tightly, it often signals that a major price movement is approaching.
The current Bollinger Band Width indicator has hit the same 63 level seen before SUI’s previous major rallies. This compression matches technical setups that preceded two earlier explosive moves in the token’s history.
In December 2023, SUI traded sideways before rallying more than 253% by March 2024. A similar pattern emerged in September 2024, leading to a 404% increase over the following months.
The mid-line of the Bollinger Bands has already been reclaimed, showing early technical strength. SUI has also bounced from the 0.618 Fibonacci retracement level, a common technical support zone.
Price Target Projections
Based on the historical pattern analysis, CryptoBullet suggested SUI could see a 150-200% rally if the technical setup plays out similarly to previous instances. This would place potential price targets between $6 and $8.
The current setup shows clear similarities to the previous two major rallies. Both earlier moves began with tight Bollinger Band compression followed by sharp upward price action.
Technical traders are watching for a breakout above the next resistance zone between $3.70 and $3.75. This level could serve as the launching point for any larger directional move.
The combination of the Google partnership news and the technical setup has created increased attention around SUI’s price action.
SUI’s current trading range spans $0.183, with the token maintaining support above the $3.50 level throughout the recent session.


