


 Price: A Golden Cross Could Set Up Bitcoins’s Next Big Move")


TLDR
-
Bitcoin broke above its all-time high by 10% after eight months of sideways movement.
-
A “golden cross” has formed, a bullish signal where the 50-day moving average crosses above the 200-day average.
-
Trading volume is up 22.97%, but open interest is slightly down, indicating mixed sentiment.
-
Technicals like RSI and MACD remain neutral or weak, suggesting hesitation in confirming the breakout.
-
Analysts say staying above $120,000 is key for a new bull run; support is near $116,400.
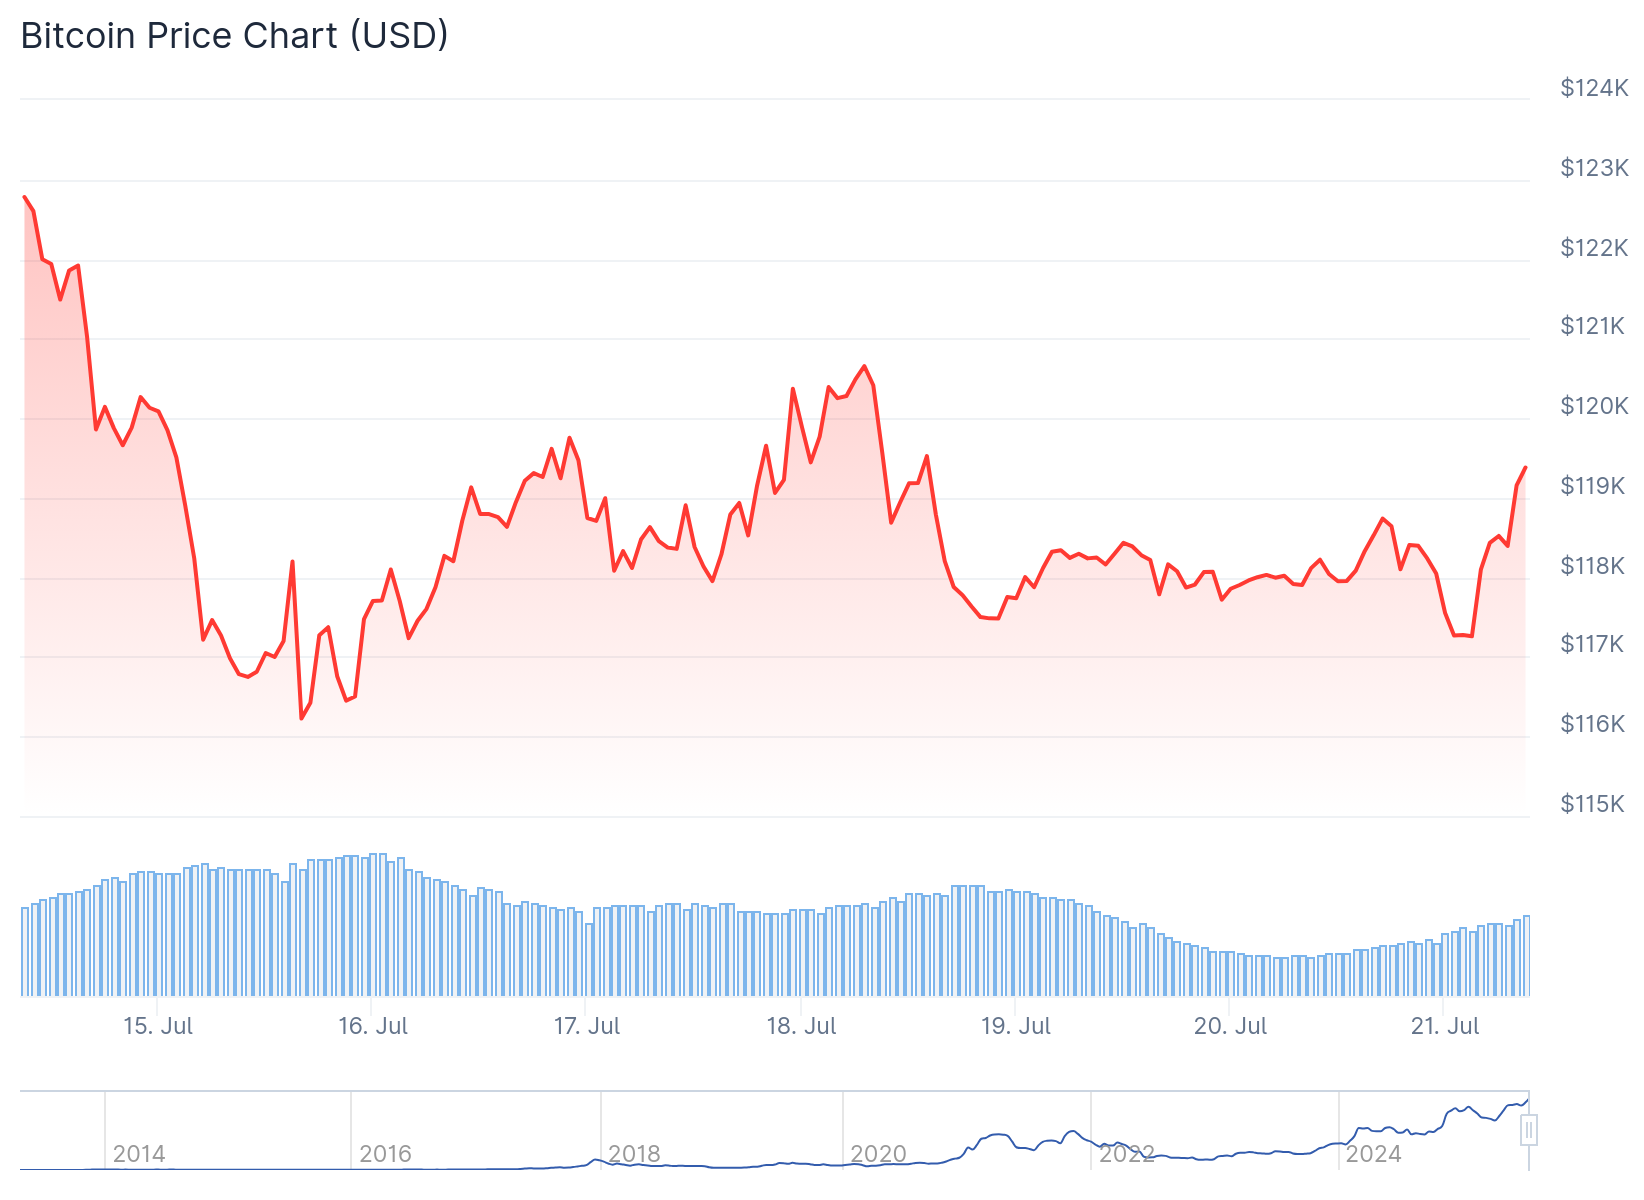
Bitcoin has moved more than 10% above its previous all-time high. This comes after nearly eight months of slow price action.
Analysts are watching the current price zone closely. Some view the move as the start of a potential new cycle. Others caution it may be short-lived.
Bitcoin is now hovering near $118,000. The breakout happened on increased volume, but many indicators are still not confirming strong momentum.
Technical Indicators Remain Split
The Relative Strength Index (RSI) is at 43.99. This is below the neutral 50 level and suggests weak buying power.
The MACD also shows hesitation. The MACD line sits at -69.34 while the signal line is at -78.23. A bullish crossover has not formed.
The last 4-hour candle closed down 0.60%, showing a lack of sustained buying. The price continues to form lower highs and higher lows.
These patterns suggest indecision. Sellers are still active, while buyers have not yet taken control.

Golden Cross Sparks Bullish Forecasts
Despite this, a golden cross has formed on Bitcoin’s daily chart. This is when the 50-day simple moving average moves above the 200-day average.
BITCOIN’S MOST RELIABLE SIGNAL JUST FLASHED
Golden Cross ✅
Past results:
2016: +139%
2017: +2200%
2020: +1190%2025 is next…
Do you want to watch the breakout… or ride it? pic.twitter.com/YqHncmnS4C
— Merlijn The Trader (@MerlijnTrader) July 9, 2025
In past cycles, this pattern has preceded large price increases. Some examples include 2017 and 2020, where Bitcoin surged over 1,000% after similar setups.
However, more recent golden crosses have led to smaller gains. In 2021 and 2023, Bitcoin rose only 50% or less after similar signals.
Traders now look to the $120,000 level as a key resistance. A clean breakout and daily close above that level may confirm the trend.
Market analyst Rekt Capital said BTC must stay above $120K and retest that level successfully to maintain momentum.
Third time has been a fantastic charm because Bitcoin broke out to new All Time Highs
And ever since Bitcoin developed this short-term range (blue), Altcoins started breaking out
If Bitcoin Daily Closes above the ~$120k Range High and post-breakout retests it into new… https://t.co/TNUwc9FauG pic.twitter.com/R5oEtO6WG6
— Rekt Capital (@rektcapital) July 17, 2025
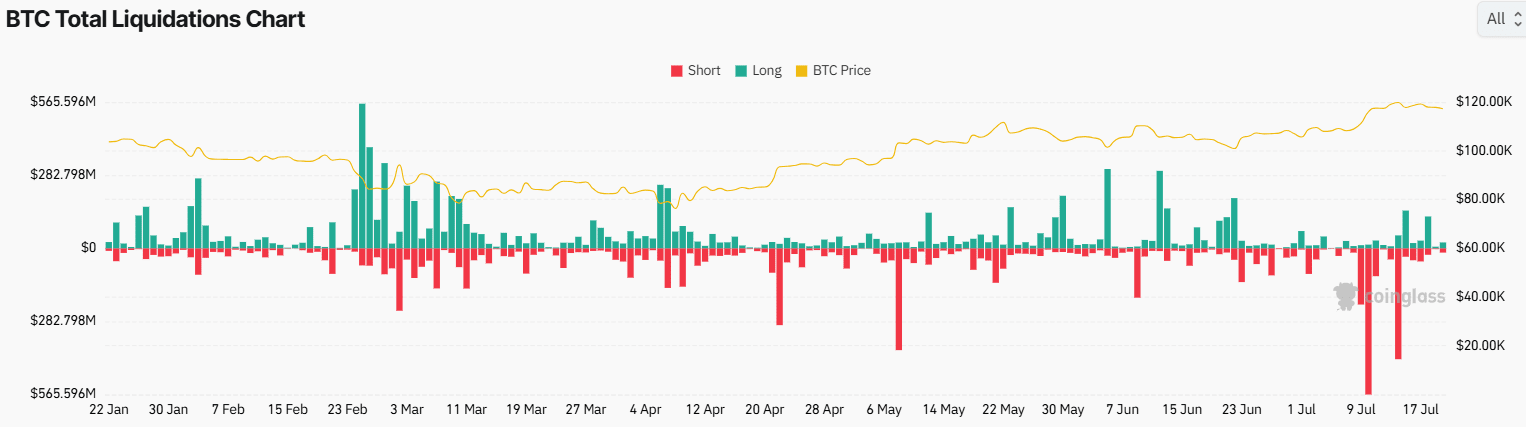
Data from Coinglass shows that trading volume rose by almost 23%, totaling over $59 billion. However, open interest fell slightly by 0.11%.
That drop in open interest shows some caution among traders. They are not yet ready to open large new positions.
Liquidation data also shows a balanced picture. Long liquidations totaled $22.46 million, and shorts were at $16.34 million.
Meanwhile, the broader market is active. Altcoins are gaining attention, which can shift capital away from Bitcoin.
Altcoin strength in past cycles has often limited Bitcoin’s upside. Traders are watching to see if this pattern repeats.
Whale activity is another factor. Large holders have been accumulating Bitcoin. These entities are often early in market moves.
Support levels are now seen at $116,400 and $116,600. Resistance remains between $118,200 and $118,600.
At press time, Bitcoin is trading around $117,930, down 0.47% in the last 24 hours.


