






TLDR
- Bitcoin closed above its 50-week moving average for the first time in 45 weeks, ending the week near $81,159.
- Galaxy Research found that 11 of 13 previous weekly reclaims of the indicator were not followed by a new cycle low.
- BTC has climbed about 29% over the past 35 days and recorded its highest weekly close in four months.
- Analysts are now watching whether Bitcoin can hold above the moving average, currently around $78,000.
- Trader Ted said a break above $83,000 would confirm the cycle bottom and outlined a potential path for BTC over the next two to three years.
Bitcoin closed above its 50-week moving average for the first time in 45 weeks, putting a closely watched long-term price indicator back in focus.
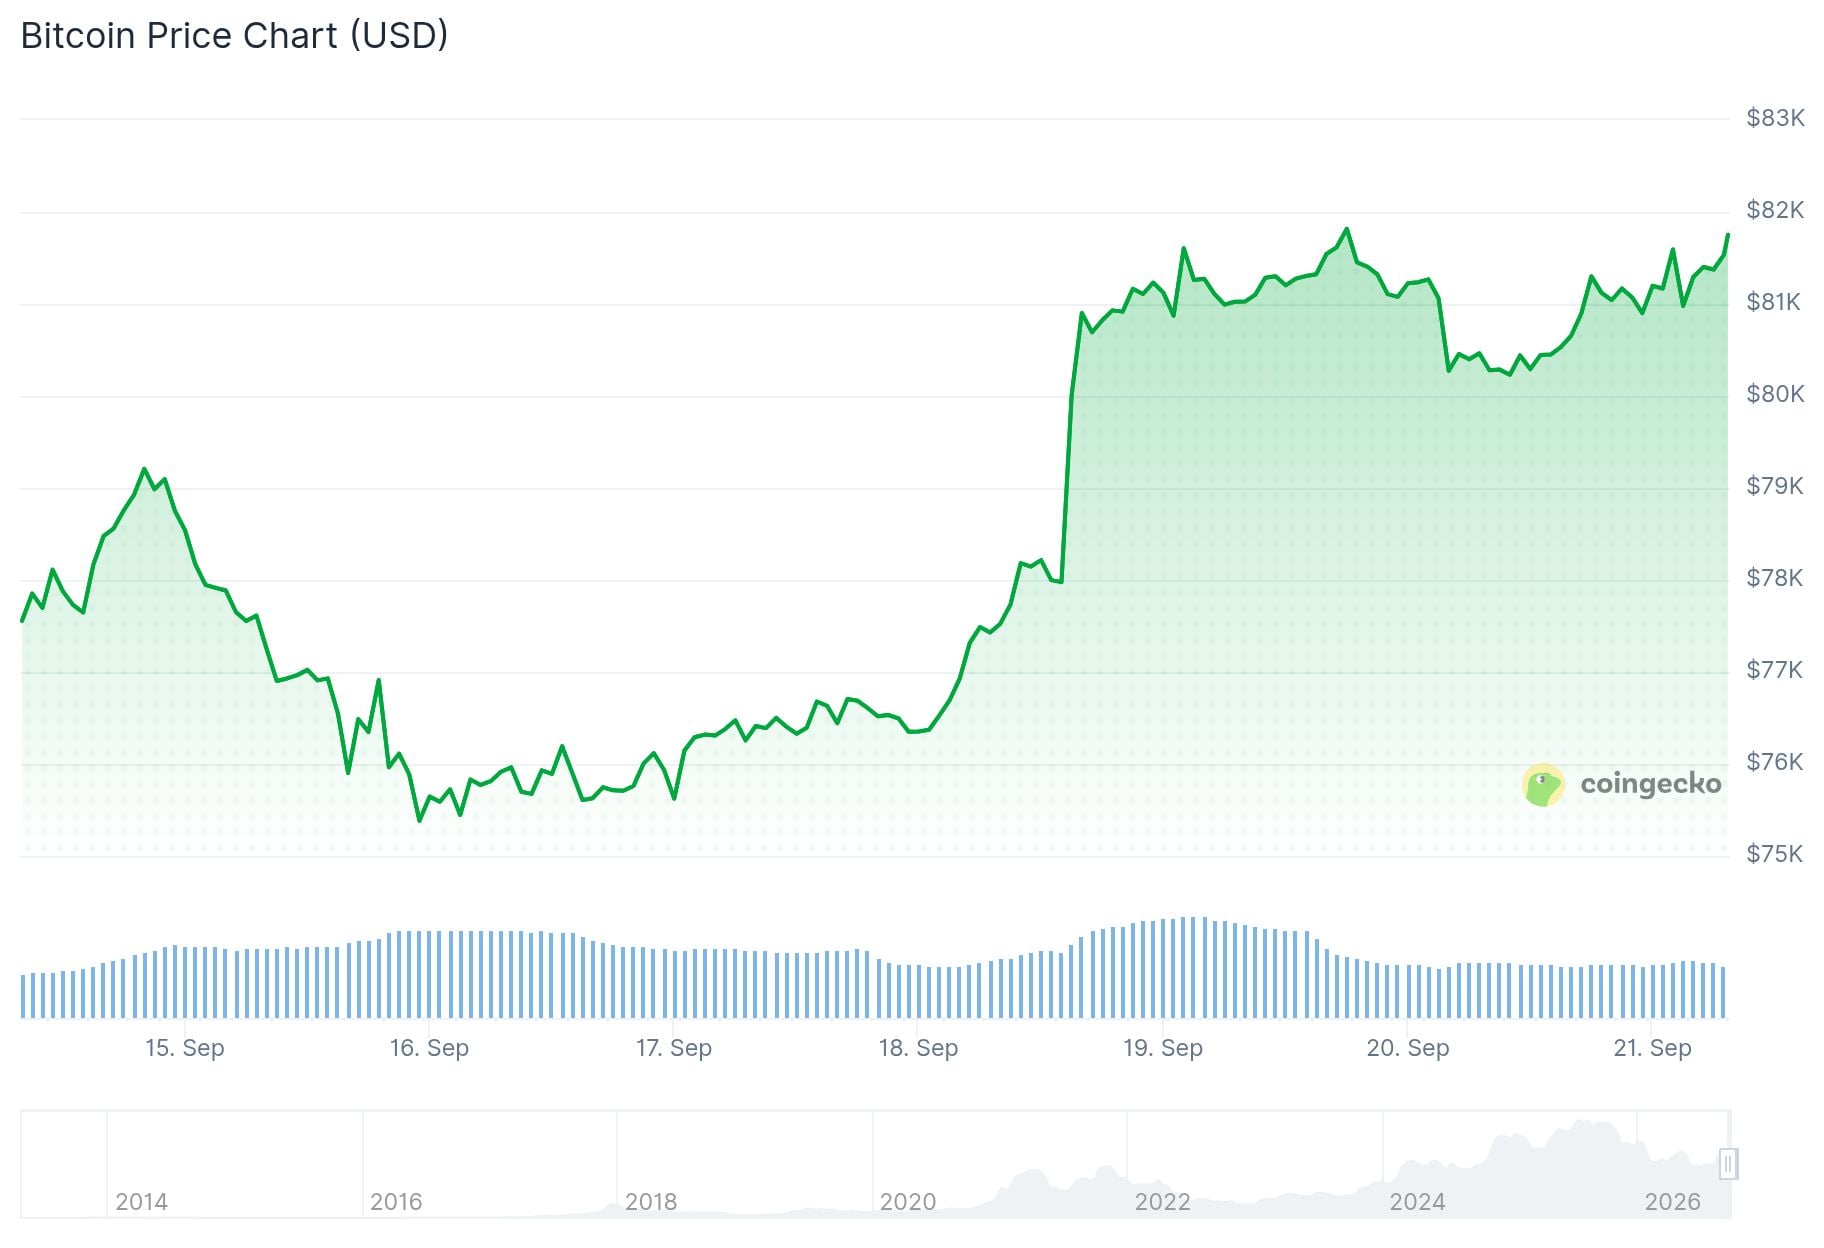
BTC ended Sunday at about $81,159 on Coinbase, above its 50-week moving average near $78,788. It was Bitcoin’s highest weekly close in four months.
The cryptocurrency gained almost 6% during the week. Bitcoin has now risen roughly 29% over the past 35 days.
Unlike a brief move through resistance, Bitcoin’s weekly candle finished above the moving average. Weekly closes are often used by technical traders to assess longer-term trends.
Bitcoin’s 50-Week Moving Average Has a Strong Historical Record
The 50-week moving average tracks Bitcoin’s average weekly closing price over roughly one year. During past bear markets, it has often acted as resistance.
BREAKING: Bitcoin printed its highest weekly close in 4 months and reclaimed the 50-week MA for the first time since Nov 2025. pic.twitter.com/K4wkX902nB
— Bull Theory (@BullTheoryio) September 21, 2026
Galaxy Research head Alex Thorn previously described the indicator as a ceiling that Bitcoin has struggled to reclaim during extended downturns.

Galaxy reviewed 13 occasions when Bitcoin moved back above the 50-week average. In 11 cases, BTC did not subsequently make a new cycle low.
Previous successful reclaims occurred in January 2012, October 2015, May 2019 and March 2023. Each came after major Bitcoin market declines.
The March 2023 crossover followed Bitcoin’s 2022 low near $15,500. BTC later reached a record near $126,000 in October 2025.
The indicator has also produced failed signals. Reclaims in December 2021 and March 2022 were followed by further declines, with Bitcoin eventually falling toward $16,000.
Bitget chief analyst Ryan Lee said the latest close strengthens the case that Bitcoin’s recovery is underway. However, he said further weekly closes and higher lows would provide more confirmation.
$83,000 Becomes the Next Bitcoin Price Level to Watch
Several traders are now focusing on $83,000 rather than the moving average alone.
Crypto trader Craig Cobb said a break above $83,000 would remove the lower high on Bitcoin’s monthly chart, meaning the longer-term trend would no longer be down.
Cobb is also monitoring Bitcoin’s three-month candle structure. He said the historical red-to-green quarterly pattern he follows has produced a new all-time high in 11 previous confirmed cases.
Analyst Ted shared a similar level on X. Ted said a Bitcoin break above $83,000 would confirm the cycle bottom, before outlining the price path he expects BTC to follow over the next two to three years.
If Bitcoin breaks $83,000, the cycle bottom will be confirmed.
After that, this is the path I expect for Bitcoin over the next 2-3 years. pic.twitter.com/ZuGmUNgH7p
— Ted (@TedPillows) September 20, 2026
Bitcoin was trading around $81,450–$81,700, leaving it above the 50-week moving average but still below the $83,000 level being watched by several traders.


