


 Price: Bulls and Bears Battle as Consolidation Tests Patience")


TLDR
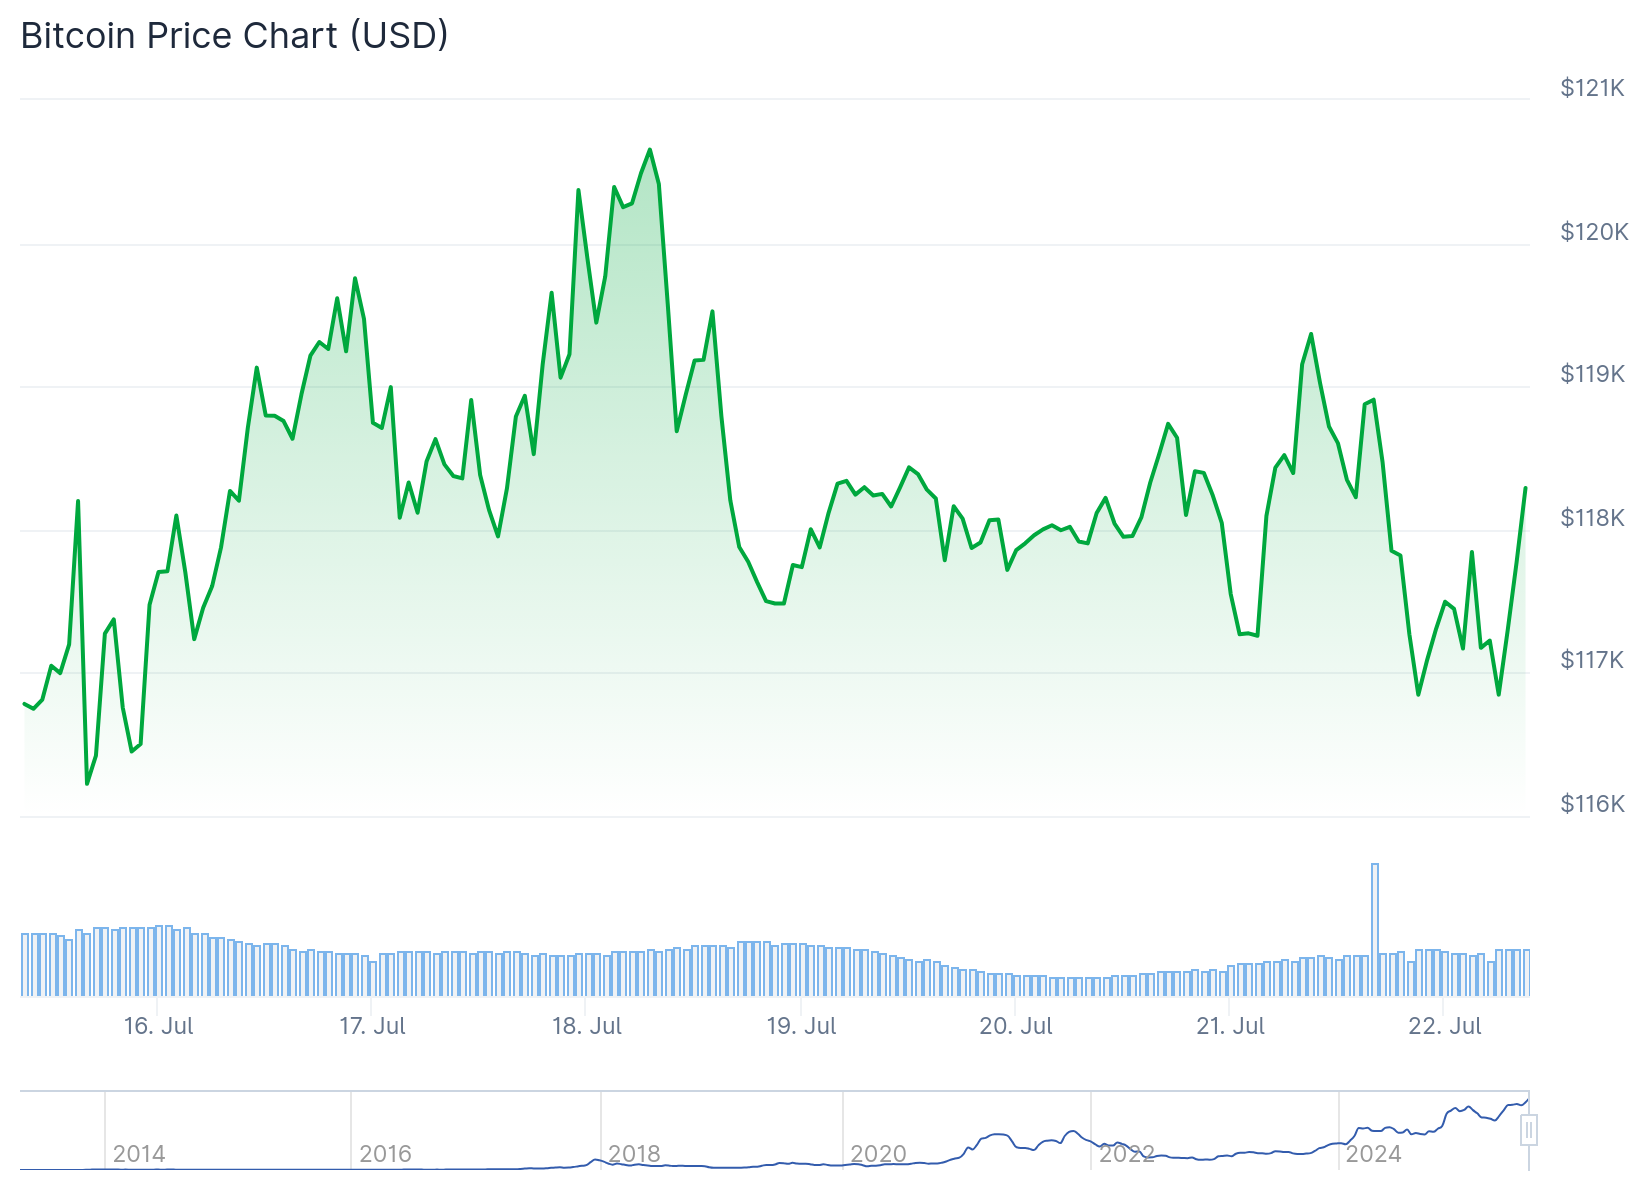
- Bitcoin remains in tight consolidation around $119,400, just 2.12% below its all-time high of $122,000
- Fear and Greed Index dropped from 70 to 67, showing weakening sentiment despite elevated greed levels
- 119,000 BTC moved into spot reserves this week, creating potential selling pressure
- Key support zones identified at $118,125 and $116,000 with $110 million in long positions at risk
- Weekly structure shows bullish divergence compared to January’s distribution pattern
Bitcoin continues to trade in a narrow range near its all-time highs, testing the patience of both bulls and bears. The leading cryptocurrency has spent a full week consolidating around $119,400, staying within striking distance of its recent peak.
The current price action mirrors a familiar pattern from January when Bitcoin reached $109,312 before entering a prolonged correction phase. During that period, the cryptocurrency ranged for 14 days before breaking down and losing the $100,000 support level.
Market sentiment remains elevated but shows signs of weakening. The Fear and Greed Index declined from 70 to 67 over the past week, marking a weekly low that suggests growing uncertainty among traders.
Supply Pressure Building
This week saw 119,000 BTC flow into spot exchange reserves, representing fresh supply that could weigh on prices. The influx of coins to exchanges typically indicates selling pressure, though strong demand can absorb this supply.
The key question remains whether buyers can continue supporting the current price levels. Early trading patterns suggest bid-side strength, with Bitcoin showing resilience during intraday dips.
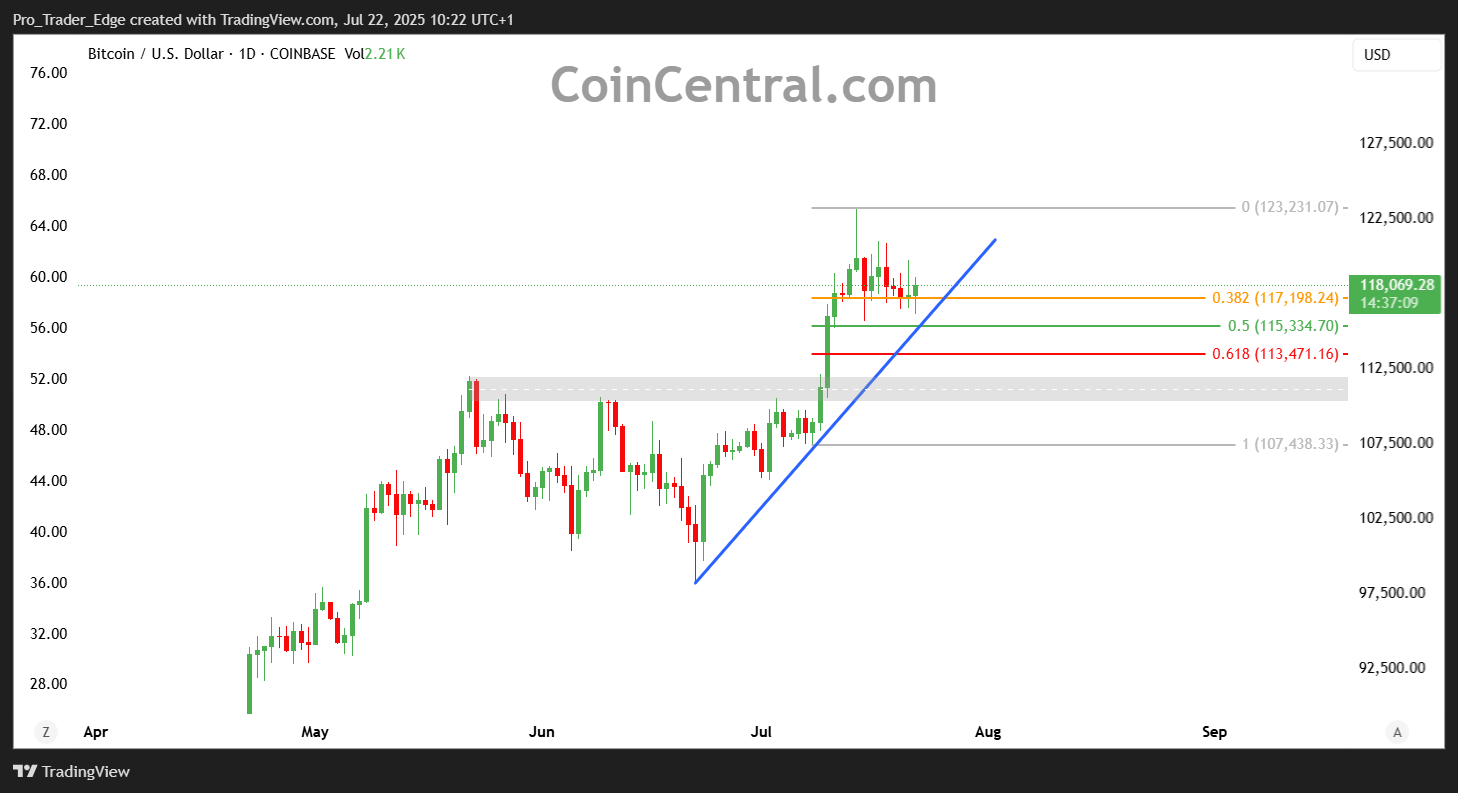
Technical analysis reveals multiple layers of support below current levels. The first major test would come at $118,125, where approximately $30.8 million in long positions are clustered.
Below that level, two additional pockets of long liquidity sit around $116,000, totaling roughly $80 million in positions. These levels represent potential targets for any downside move.

Weekly Structure Provides Hope
Despite the challenges, the weekly chart structure offers some encouragement for bulls. Unlike January’s distribution pattern, which began with a 4.69% red weekly candle, the current setup shows different characteristics.
The second weekly candle opened with a 1.40% intraday bounce, demonstrating early buying interest. This divergence from the January pattern suggests stronger underlying demand.

Technical analysts point to a clean H2 demand zone below current levels as a potential reaction point. However, traders note that price could dip below this zone to sweep trendline liquidity formed by three distinct touches.
Market makers often target these obvious levels before allowing prices to recover. This pattern has caught many traders off guard in previous cycles.
The consolidation phase near all-time highs represents a critical juncture for Bitcoin. Historical patterns suggest that extended ranging periods near peaks can lead to either continuation moves or deeper corrections.
Current market dynamics show mixed signals, with elevated sentiment offset by increasing supply pressure. The ability of demand to absorb the 119,000 BTC that entered exchanges this week will likely determine near-term direction.
Trading volume and price action in the coming days will provide clearer signals about whether Bitcoin can maintain its upward trajectory or requires a deeper pullback before the next leg higher.
Price remains above key technical levels, with the $116,000-$120,000 range potentially serving as a support base. As long as sentiment holds above 60 and weekly structure remains intact, the short-term outlook favors continued consolidation rather than sharp declines.
Final Thoughts
The Bitcoin price continues to consolidate near all-time highs, with mixed market signals creating uncertainty for traders. While supply pressure builds, the bullish divergence from January’s distribution pattern provides hope for further gains if demand can absorb the incoming supply.


