






TLDR
- US spot Bitcoin ETFs pulled in $986.9M last week, bringing the three-week total to $3.8B
- BlackRock’s IBIT led Friday inflows with $117.4M, about 67% of the day’s total
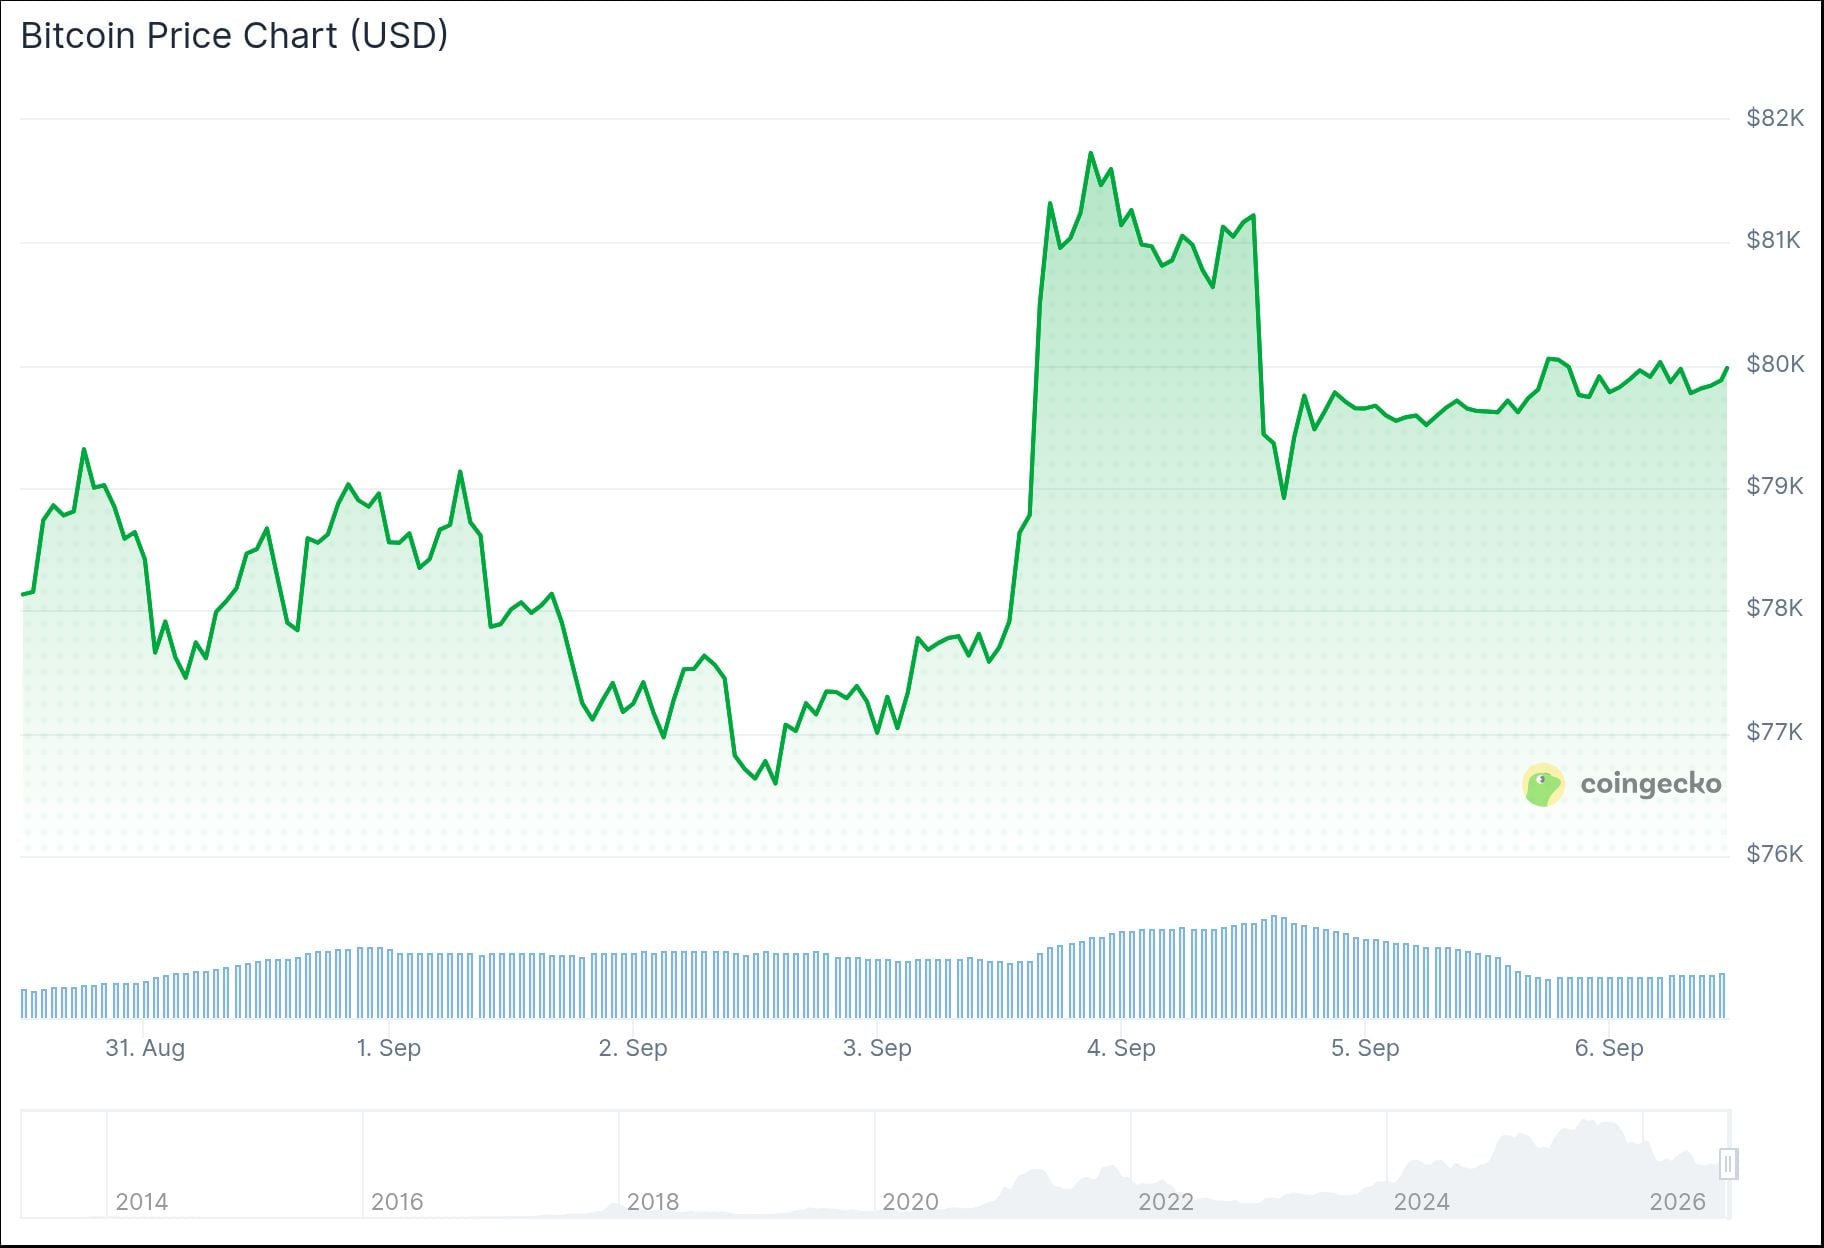
- Bitcoin traded at $79,716 at time of reporting, up ~2.6% over seven days
- Bitcoin’s 50-day EMA is closing in on the 200-day EMA, with a golden cross projected around September 11
- Coin Bureau analyst flagged the upcoming golden cross as a historically bullish signal, though notes it is a lagging indicator
US spot Bitcoin ETFs have just posted their best three-week inflow run of 2026, pulling in $3.8 billion in total net flows. That stretch includes $986.9 million in the week ending Friday, September 5.
Total net assets across all US spot Bitcoin ETFs stood at $101.3 billion on Friday, after briefly touching $103.3 billion the day before. Cumulative net inflows reached $55.6 billion.
BlackRock’s iShares Bitcoin Trust (IBIT) led the pack on Friday, drawing $117.4 million. Fidelity’s Wise Origin Bitcoin Fund (FBTC) was the only other fund to see inflows, adding $57.2 million.
JUST IN: 🇺🇸 U.S. $BTC ETFs saw $986.8 million in inflow this week. pic.twitter.com/DamQf2D2LU
— Whale Insider (@WhaleInsider) September 5, 2026
The week’s total Friday inflows came in at $174.6 million, down sharply from the $731 million recorded on Thursday.
Bitcoin briefly dipped below $79,000 on Friday before recovering to $79,716 at the time of publication. That’s still a gain of about 2.6% over the past seven days.
ETF Flows vs. Ether and XRP
Bitcoin ETF inflows rose roughly 7% week-over-week. In contrast, US spot Ether ETF inflows dropped 74% to $218.4 million, while XRP ETF inflows fell 83% to $19 million.

Both Ether and XRP ETFs remain in positive territory for the year. Ether ETFs have logged about $863 million in year-to-date net inflows and XRP ETFs have brought in around $515 million.
Year-to-date net flows for Bitcoin ETFs are still roughly $1 billion negative, despite the recent turnaround.
Golden Cross Watch
At the same time, a key technical signal is forming in Bitcoin’s price chart.
As of September 1, Bitcoin’s 50-day exponential moving average sat at $70,030, while the 200-day stood at $72,323. The gap between the two is about 3.2%.
A crossover — known as a golden cross — is projected to occur around September 11 if prices hold near current levels.
Crypto analyst account Coin Bureau posted on X that Bitcoin is “about to flash a golden cross for the first time since November 2025.” The account highlighted that the last three completed golden crosses sent Bitcoin up 50%, 45%, and 60% respectively. However, they also warned it is a lagging signal that has “sometimes reversed within weeks.”
🚨BULLISH: Bitcoin is about to flash a golden cross for the first time since November 2025.
Its 50-day average is crossing back above the 200-day, one of the oldest bullish signals in markets.
The last three completed golden crosses each sent Bitcoin sharply higher:
— Coin Bureau (@coinbureau) September 5, 2026
Across 12 golden cross signals since 2012, Bitcoin averaged a 24.9% three-month gain, though results varied widely.
CryptoQuant data noted the late-August rally was driven mainly by short covering in derivatives, not fresh spot buying.
Bitcoin was trading near $77,000 on September 3, already above both moving averages.


