


 Price: Flash Crash Tests $109,000 Support Level as Retail Investors Exit")


TLDR
- Bitcoin’s flash crash on August 24th cleared out overleveraged positions with 18% long liquidation dominance, the highest in months
- Newer investors holding coins less than a month face 3.5% unrealized losses while 1-6 month holders remain profitable at 4.5% gains
- Key support zone identified at $100,000-$107,000 where Short-Term Holder Realized Price meets the 200-day moving average
- 94% of traders were liquidated over the past three months during ongoing liquidity hunts in both directions
- Bitcoin must hold above $108,800 cost basis level to avoid deeper correction toward $92,000-$93,000 range
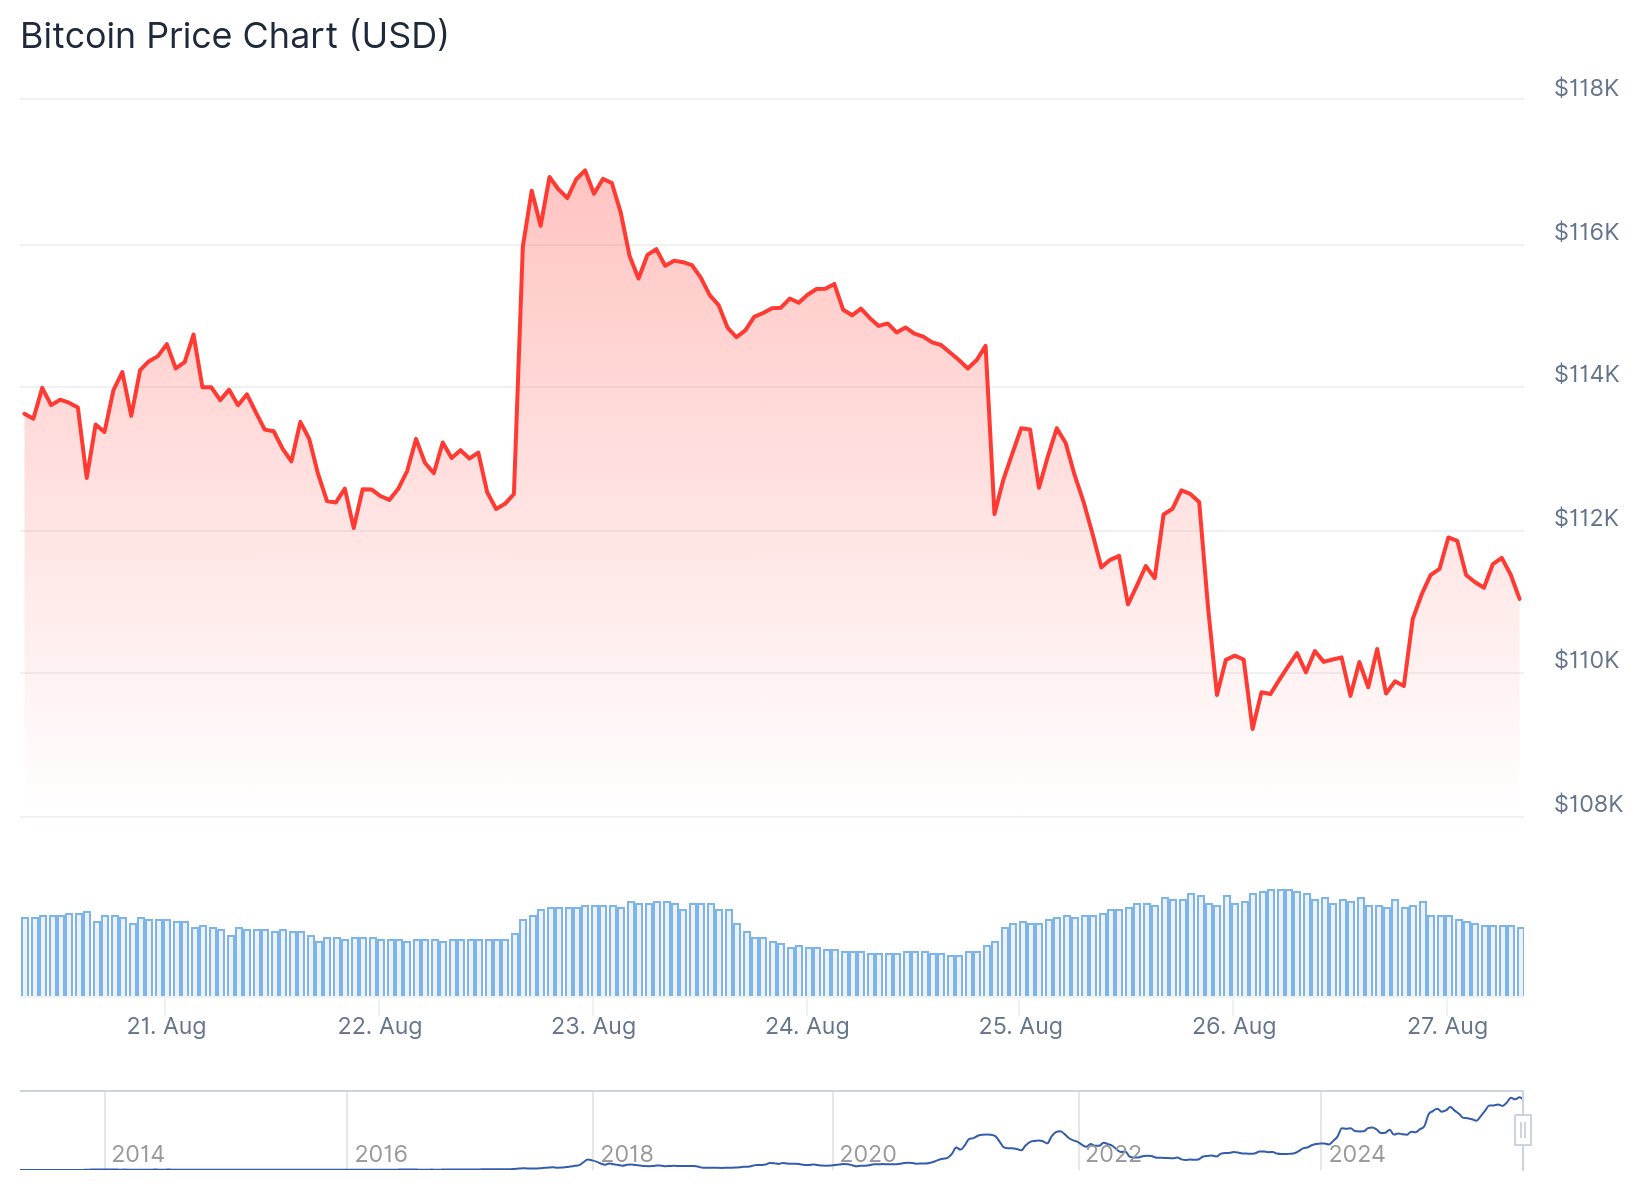
Bitcoin experienced a sharp pullback on August 24th that sent newer investors running for the exits. The cryptocurrency held just above $110,000 at press time, matching the average cost basis for investors who bought within the past one to three months.
The flash crash turned into a major long-deleveraging event. Data showed long liquidation dominance spiking to 18%, the highest level seen in months.
This clearing of overleveraged positions often helps reset market conditions. With speculative excess reduced, Bitcoin may find firmer ground for a potential recovery.
Market Shakeout Targets Newest Investors
On-chain data revealed the pain concentrated on Bitcoin’s newest buyers. Investors holding coins for less than a month now sit on average unrealized losses of 3.5%.

Many of these short-term holders have already sold their positions. This selling pressure drove a clear drop in supply from the newest investor group.
However, the broader short-term holder group aged one to six months remained profitable. These investors showed average gains of 4.5% despite the recent volatility.
The data suggests only “tourist” buyers were flushed out of the market. More resilient hands are now holding the coins previously owned by fearful sellers.

This transfer of coins from weak hands to stronger holders typically reduces overhead supply. Lower supply pressure can help establish stronger support levels going forward.

Over the past three months, 94% of traders faced liquidation during ongoing liquidity hunts. The market has been driven primarily by bidirectional sweeps targeting both long and short positions.
When applying a 50% liquidity threshold filter, only densely concentrated order clusters remain visible. This indicates price actively sought out large position clusters to clear them from the market.
Critical Support Zone Comes Into Focus
Analysts identified a key support zone between $100,000 and $107,000. This range aligns with the Short-Term Holder Realized Price and the 200-day simple moving average.
The nearest strong support zone is the 100K–107K range, where the STH Realized Price and SMA 200D intersect.
Below that is additional support around 92–93K, a deeper support level reflecting the cost basis of short-term investors who held coins for 3 to 6 months. This will become… pic.twitter.com/5z0qU60syy— Axel 💎🙌 Adler Jr (@AxelAdlerJr) August 26, 2025
The intersection of these technical levels strengthens the reliability of this support zone’s defensive role. Many experts predict a deeper retreat to $92,000-$93,000 if this zone breaks.
A massive long cluster has formed around $104,000-$107,000 according to liquidation heatmap data. This concentrated liquidity zone matches the identified support area.
The $108,800 level serves as a critical short-term dividing line. This price represents the cost basis for recent investors and acts as a bull-bear threshold.
A stable close above $108,800 would signal reduced selling pressure from short-term holders. Losing this level could trigger additional selling and push prices toward the lower support zone.
Currently trading around $111,000, Bitcoin sits about 13% below recent highs. If the short-term holder realized price breaks, technical analysis suggests 10-15% additional downside remains possible.
The current correction appears to be a healthy market reset rather than a full breakdown. Coins are moving from fearful sellers to more resilient investors, which typically creates stronger support levels.
Bitcoin’s spot taker activity has turned sell-dominant, highlighting fading buy-side demand. This shift increases the risk of a drop toward the $107,557 support level.
The key level to watch remains $110,800, which represents the average cost basis of one to three month holders. Holding above this level could stabilize market sentiment and confirm the recent selling as a healthy shakeout.


