






TLDR
- DOGE is up 2.25% today to $0.073, driven by US CPI data showing inflation dropped to 3.5%
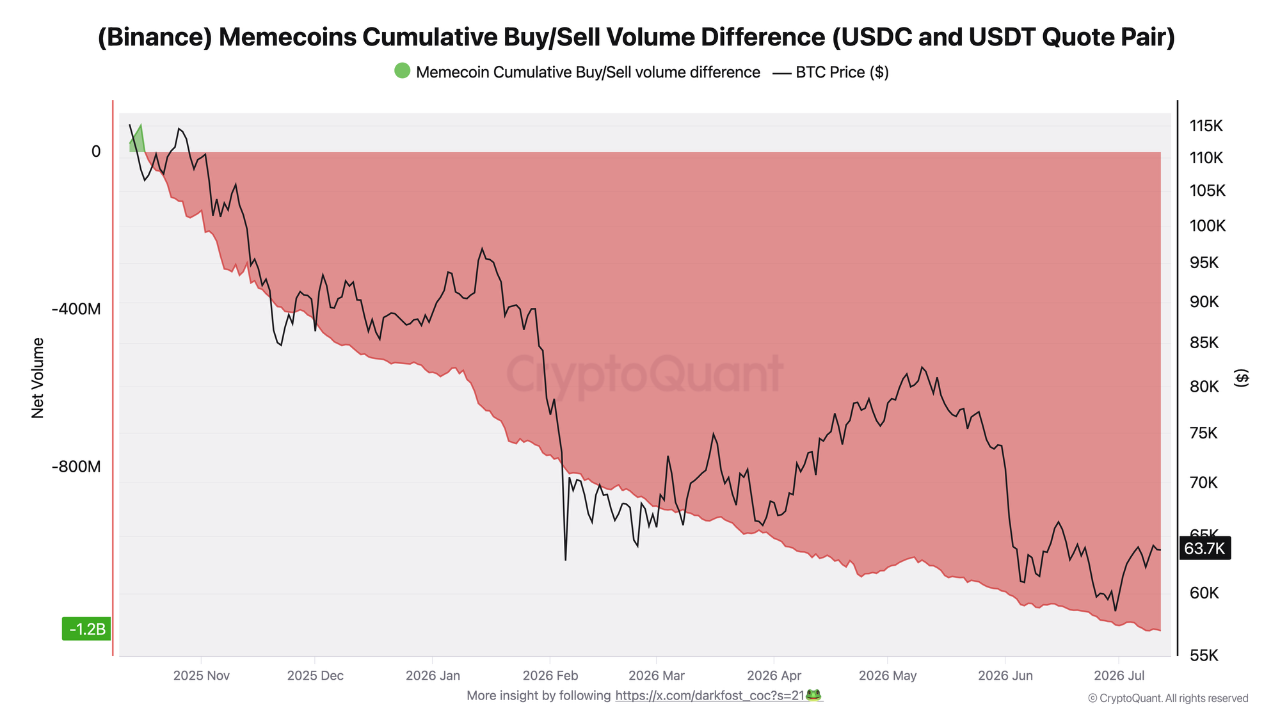
- Binance traders have sold $1.2 billion worth of meme coins since October 2025
- DOGE is down 73% from its October 2025 high of $0.26
- Dogecoin ETFs have seen zero inflows since June 17, with just $9.9M in net assets
- Key support sits at $0.071; a break lower could push DOGE toward $0.068–$0.064
Dogecoin is trading at $0.073 on July 14, up 2.25% on the day. The bounce comes after US inflation data showed the CPI dropped to 3.5%, giving risk assets a brief lift.
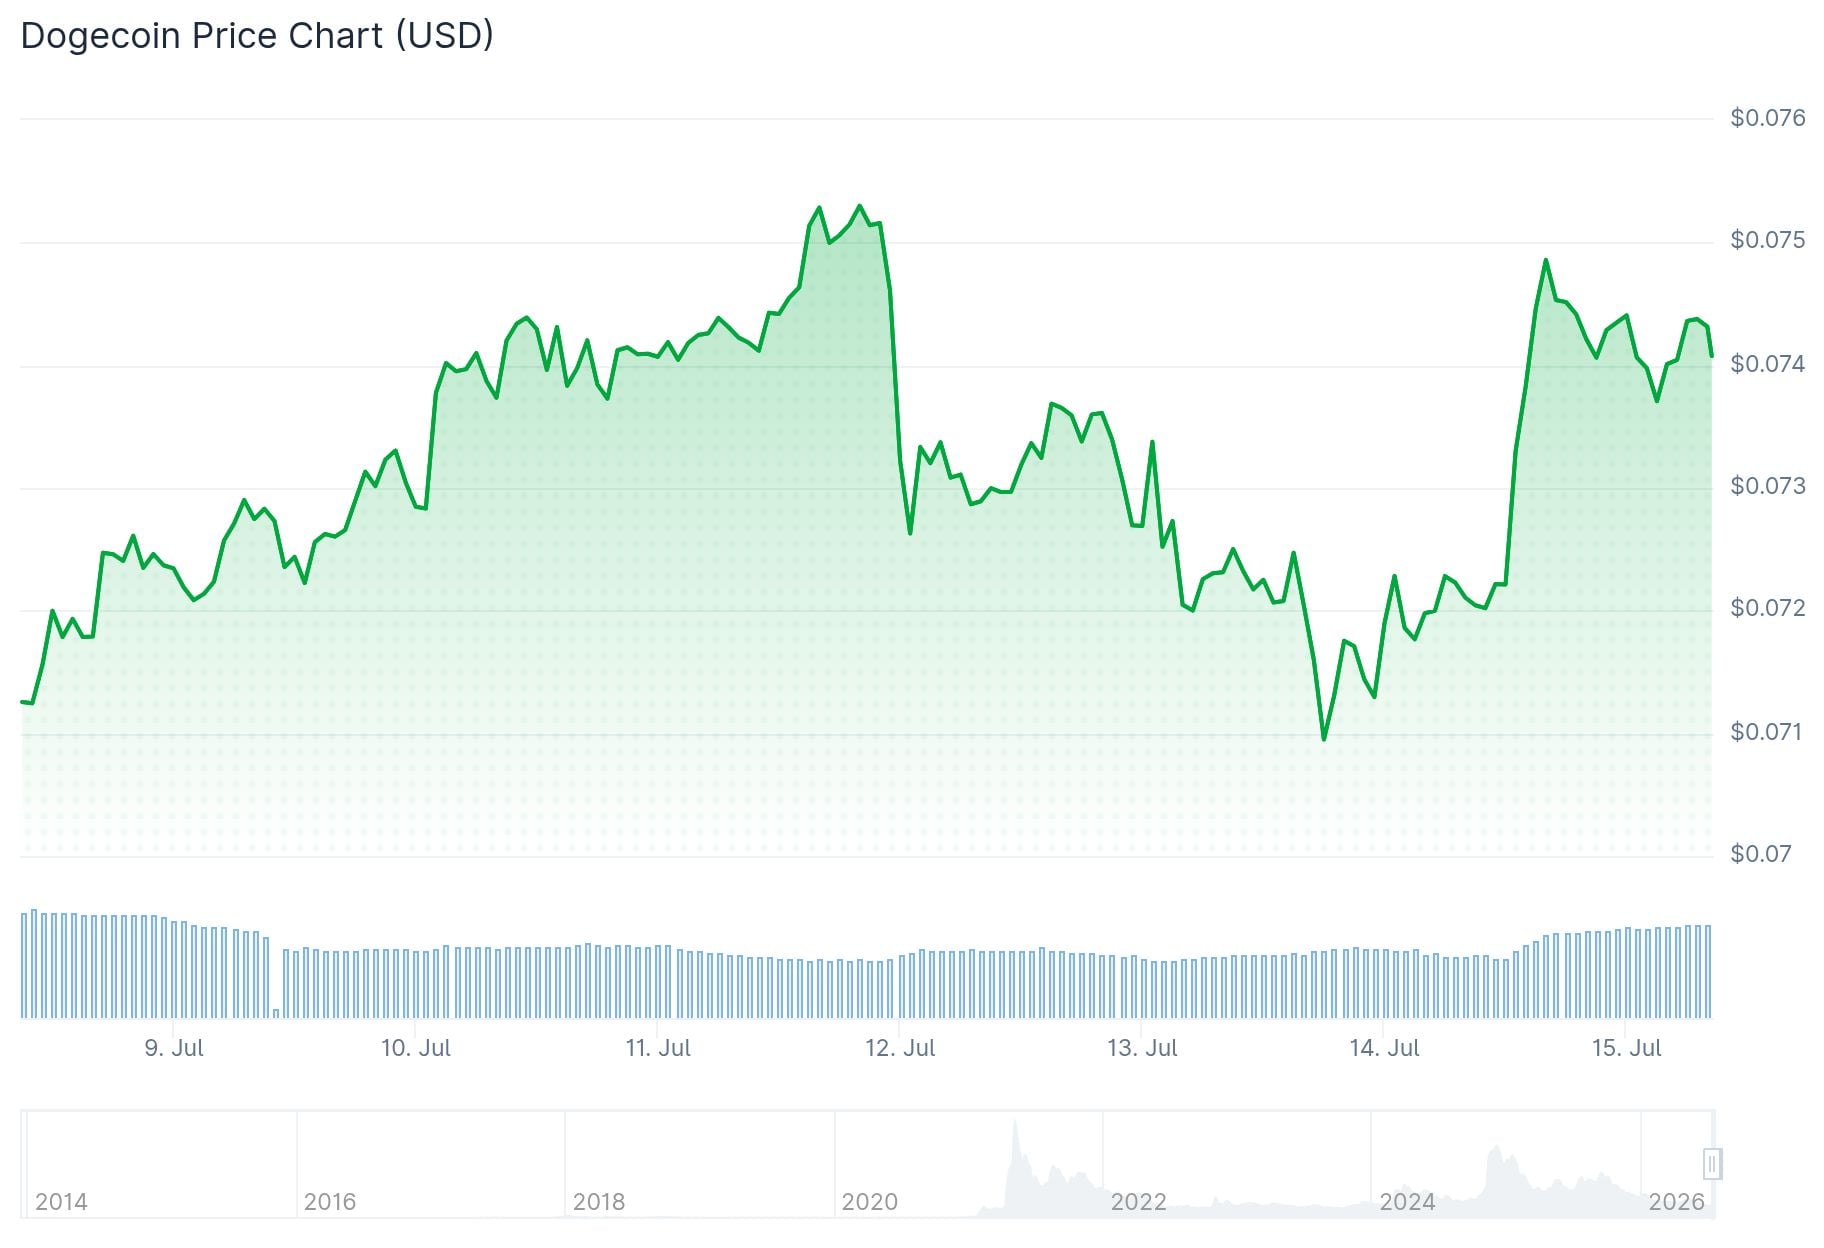
Despite the daily gain, the bigger picture for DOGE remains under pressure. The coin has dropped 73% since October 2025, when it was trading near $0.26. Bitcoin fell roughly 50% in the same period, meaning DOGE has underperformed significantly.
CryptoQuant data shows Binance traders have sold $1.2 billion worth of meme coins since October 2025. Analyst Darkfost describes meme coins as the “riskiest assets” in crypto, and warns that today’s gains may not last without sustained buying pressure returning to the market.
Analyst Kamran Asghar noted on X that $DOGE is holding a key weekly accumulation zone near $0.07, where previous cycle bottoms have formed, keeping the door open for a macro recovery toward higher price targets.
$DOGE is holding a key weekly accumulation zone near $0.07 where previous cycle bottoms formed keeping the door open for a macro recovery toward higher price targets pic.twitter.com/8AjI9HlTpP
— 𝐊𝐚𝐦𝐫𝐚𝐧 𝐀𝐬𝐠𝐡𝐚𝐫 (@Karman_1s) July 14, 2026
Technical Picture Remains Bearish
DOGE is currently trading below its 200-day, 100-day, and 50-day EMAs. The RSI sits at 41, still in bearish territory, though it is rising. A move above 50 on the RSI could shift momentum and push price toward the 50-day EMA at $0.082.
On the daily chart, DOGE has broken below the $0.0715 support level after a failed recovery attempt near $0.078. If the price closes below $0.0715, analysts are watching $0.068 and the $0.064–$0.066 zone as the next downside targets.

A potential bullish W pattern is forming on the daily chart if DOGE can hold the $0.071 support. If that plays out, the first target is the July 4 high of $0.079, with a possible 10% move to $0.087 beyond that.
Analyst Trader Tardigrade points to the monthly chart, arguing the 2021–2026 pattern mirrors the 2014–2017 cycle, which preceded Dogecoin’s major 2017–2021 rally. The chart shows a falling wedge that could signal a longer-term reversal if DOGE breaks out and holds the move.
$Doge/monthly#Dogecoin is following the exact same sequence — and we're almost at the end.
🔴 Red arrow: Bearish trend
🟣 Purple arrow: Mild recovery
🟠 Orange Falling Wedge: Final compression
🟡 Yellow arrow: Bull run2014-2017: Sequence complete → 2017-2021: Massive surge… pic.twitter.com/uR1JjUcGxU
— Trader Tardigrade 🧬 (@TATrader_Alan) July 13, 2026
ETF Demand and Open Interest Fade
Dogecoin ETFs have recorded zero inflows since June 17. The products have seen no flows for six consecutive days since July 2 and hold just $9.9 million in net assets — equal to 0.09% of DOGE’s total market cap.
Open interest has dropped from $1.76 billion in May 2026 to $1 billion as of July 14. The long/short ratio has fallen to 0.88, per CoinGlass data, meaning more traders are positioned for further downside than upside.
The launch of Robinhood Chain on July 1 has sparked fresh interest in some meme coins, with its token CASHCAT reaching a $138 million market cap since launch.


