






TLDR
- ETH is trading at $1,920.43 with a market cap of $231.76 billion
- Two monthly TD Sequential Buy signals (Black 9 and S13) have appeared on the chart
- The $1,800–$1,850 demand zone has held during recent dips
- Key resistance sits between $1,980 and $2,000, with $2,100 as the next upside target
- Spot Ethereum ETFs saw $244.94 million in net inflows last week, the highest in four months
Ethereum is trading around $1,920.43, holding above a key demand zone as technical signals on its monthly chart point to a possible trend reversal.
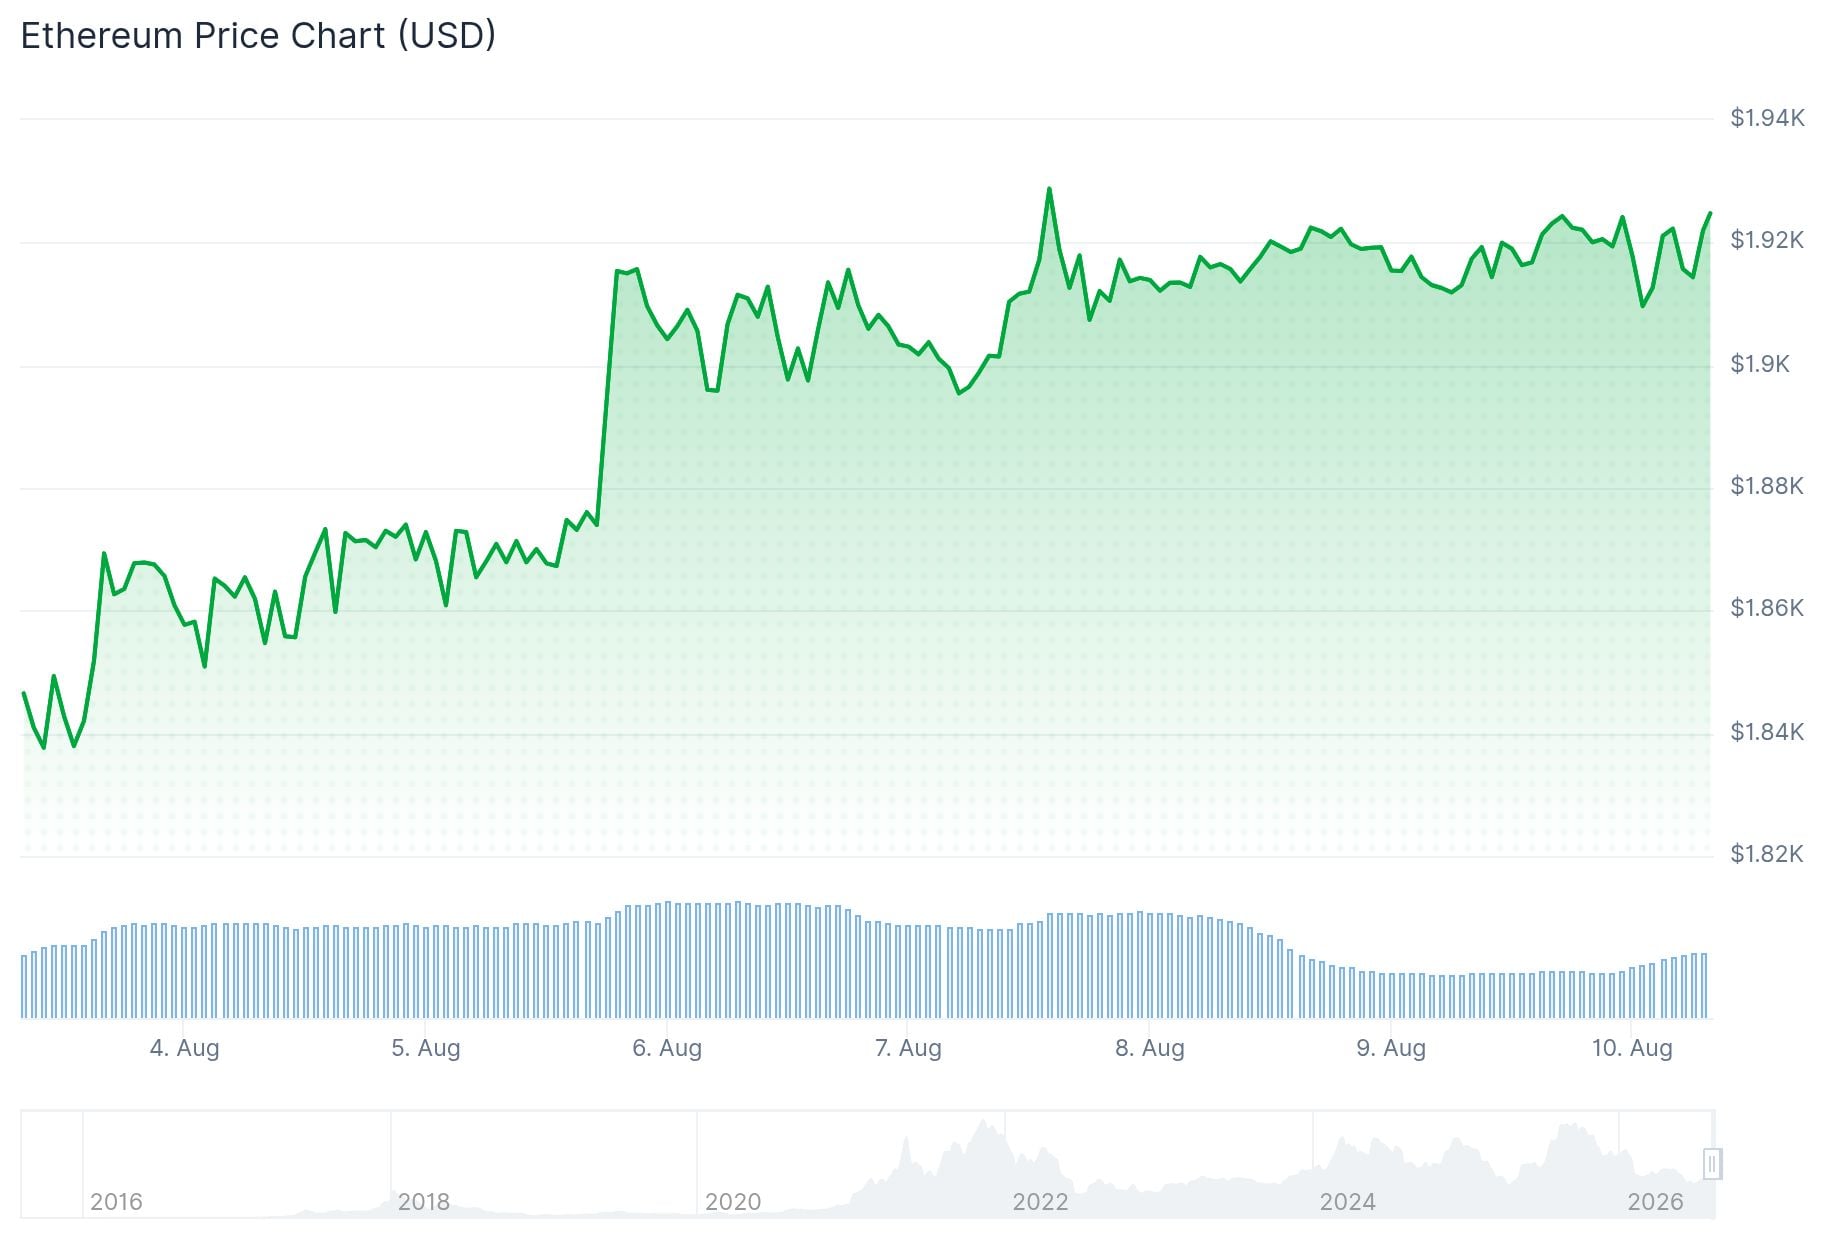
The 24-hour trading volume stands at $6.78 billion. Ethereum’s market cap is approximately $231.76 billion, making up roughly 10.49% of the total crypto market.
Two monthly TD Sequential Buy signals have appeared on ETH’s chart: a Black 9 and an S13. These signal types have appeared before at major turning points in Ethereum’s price history.
Analyst Ali Charts pointed to past examples. A Black 9 buy signal in September 2022 was followed by a 236% rally. An A13 buy signal in April 2025 led to a 258% gain. Past performance does not guarantee future results, but the signals are being watched closely.
ETHEREUM: TWO MONTHLY BUY SIGNALS
Last month, the TD Sequential flashed two buy signals on Ethereum's monthly chart: a black 9 and an S13.
This is a macro bullish development worth paying attention to. Over the past four years, every TD Sequential signal on the monthly chart… https://t.co/1Mk3vzKLl4 pic.twitter.com/iY9FmmxOxK
— Ali Charts (@alicharts) August 8, 2026
Analyst Ted (@TedPillows) noted that ETH is still holding above the $1,900 level. He said that as long as this zone holds, he expects Ethereum to push above $2,000.
$ETH is still holding above the $1,900 level.
As long as this zone holds, I expect Ethereum to pump above $2,000. pic.twitter.com/7dwQKqGWti
— Ted (@TedPillows) August 9, 2026

ETH has repeatedly defended the $1,800–$1,850 demand zone, where buyers have stepped in during dips. This area remains the key level to watch on the downside.
Resistance at $2,000 Remains the Key Level
The $1,980–$2,000 range has been a barrier during the recent recovery. A clean breakout above $2,000 would be the clearest sign that momentum is building.
If ETH clears that resistance, the next target is $2,100. That level lines up with the 200-day EMA, which sits around $2,124.
From a technical standpoint, ETH is trading above its 50-day EMA at $1,864, but is still capped by the 100-day EMA near $1,924. The RSI is around 56, showing steady but not overheated momentum.
The MACD line remains slightly negative but is improving, suggesting that selling pressure is easing.
Ethereum ETF Inflows Hit Four-Month High
On the institutional side, spot Ethereum ETFs recorded $244.94 million in net inflows last week. That was the highest weekly figure in nearly four months.
Bitcoin Spot ETFs Saw $854M in Net Inflows Last Week; Ethereum ETFs Took In $245M
From August 3 to 7 (ET), Bitcoin spot ETFs recorded $854 million in net inflows, while Ethereum spot ETFs saw $245 million, marking five consecutive weeks of inflows. Solana, XRP and HYPE spot ETFs… pic.twitter.com/64xtJ53EcS
— Wu Blockchain (@WuBlockchain) August 10, 2026
Two wallets also acquired 80,000 ETH worth approximately $152 million in recent days.
If ETH loses the $1,800 support zone, the bullish structure on the chart would weaken. The next major support below that sits at $1,385.
ETH is currently trading just below the 100-day EMA at $1,924, which is the nearest resistance level to watch right now.


