


 Stock: Huawei Unveils Rival AI Platform as U.S. Strategy Fuels Nvidia Rally")


TLDR
- Huawei’s CloudMatrix 384 aims to rival Nvidia’s H100 in AI performance
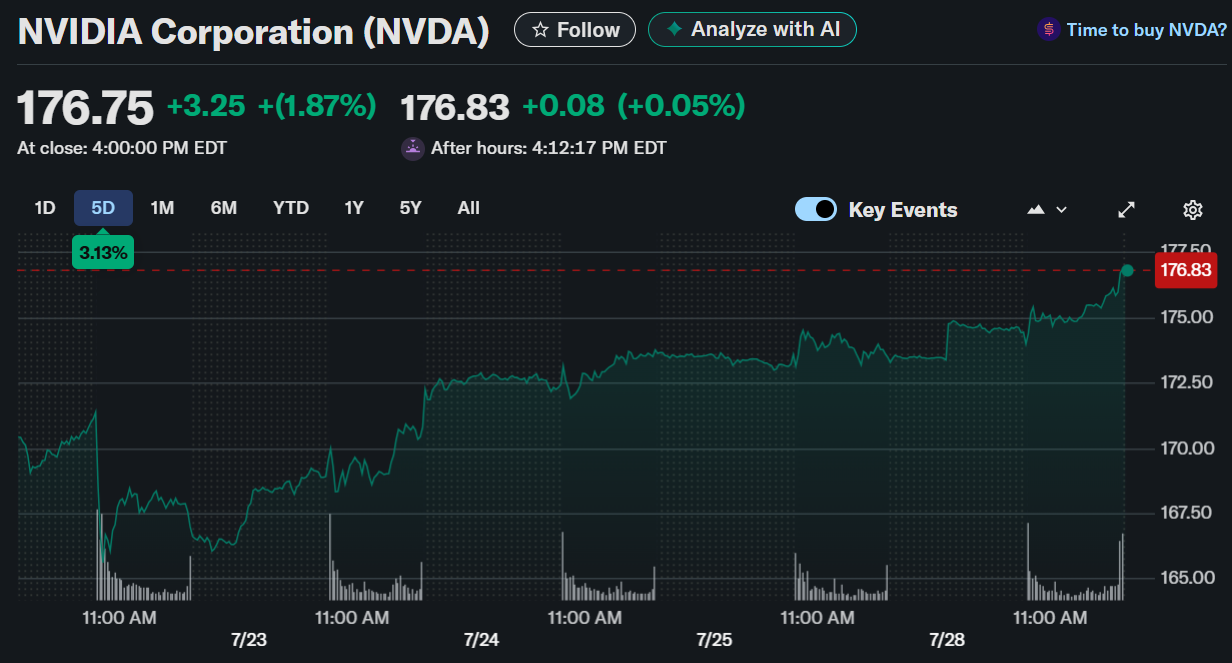
- Nvidia stock trades at $174.85 after a 0.78% gain
- U.S. releases 90-point AI plan to boost domestic dominance
- Nvidia outpaces S&P 500 with over 1600% 5-year return
- Investors stay bullish on Nvidia’s Blackwell chips despite rising competition
At the World Artificial Intelligence Conference in Shanghai, Huawei Technologies introduced its CloudMatrix 384 AI computing system, a direct challenge to Nvidia’s dominant H100 GPUs. The CloudMatrix 384 boasts multi-petaflop performance and uses custom chips designed for optimized AI training. It also incorporates innovations in interconnects, cooling systems, and power management.
Huawei is targeting Chinese enterprises and cloud providers facing U.S. restrictions on Nvidia chip access. Analysts believe this could erode Nvidia’s near 80% share in the high-end AI accelerator market.
Nvidia Stock Reacts to U.S. AI Plan
Nvidia (NASDAQ: NVDA) was trading at $174.85 as of 12:58 PM EDT, up 0.78%, following the Trump administration’s release of a broad AI policy initiative.
Titled “America’s AI Action Plan,” the 25-page proposal includes 90 measures designed to eliminate regulatory barriers, accelerate data center development, and encourage AI adoption.
Measures include fast-track permitting, relaxed environmental oversight, and increased access to federal land for infrastructure. While specific rules targeted for repeal were not named, officials emphasized efforts to counter Chinese AI growth and censorship.

Nvidia’s Blackwell Chips and Market Dominance
Despite new competition, investors remain focused on Nvidia’s Blackwell architecture, expected to maintain the firm’s edge in data center AI chips. With a market capitalization of $4.23 trillion, Nvidia maintains a commanding position in profitability and technology leadership.
The company boasts a 51.69% profit margin, 53.24% return on assets, and 115.46% return on equity. It reported trailing twelve-month revenue of $148.51 billion and net income of $76.77 billion. Free cash flow stands at $55.44 billion with total cash reserves of $53.69 billion.
Performance Overview
As of July 28, 2025, Nvidia’s performance continues to outpace the broader market. Its year-to-date return stands at 30.22% versus the S&P 500’s 8.63%. On a one-year basis, Nvidia has gained 54.70%, compared to the benchmark’s 17.04%. Over three years, Nvidia posted an eye-popping 873.63% return, while the S&P 500 rose 56.89%.
The five-year performance tells a similar story: Nvidia is up 1,617.21%, dwarfing the S&P 500’s 98.51% gain.
Valuation Metrics Show High Investor Expectations
Nvidia’s trailing P/E ratio sits at 55.97, with a forward P/E of 38.91, highlighting strong growth expectations. Its PEG ratio (5-year expected) is 1.68, and the price-to-sales ratio is 28.90. Price-to-book stands at 50.47, reflecting market confidence in the company’s long-term outlook. The company has a total debt-to-equity ratio of 12.27%, suggesting prudent financial management relative to its growth trajectory.
Considering a new stock? You may want to see what’s on our watchlist first.
Our team at Knockout Stocks follows top-performing analysts and market-moving trends to spot potential winners early. We’ve identified five stocks gaining quiet attention that could be worth watching now. Create your free account to unlock the full report and get ongoing stock insights.Get 3 Free Stock Ebooks
Discover top-performing stocks in AI, Crypto, and Technology with expert analysis.
- Top 10 AI Stocks - Leading AI companies
- Top 10 Crypto Stocks - Blockchain leaders
- Top 10 Tech Stocks - Tech giants


