






TLDR
- SOL is down 3% on Wednesday and closing in on the 50-day EMA support at $76.67
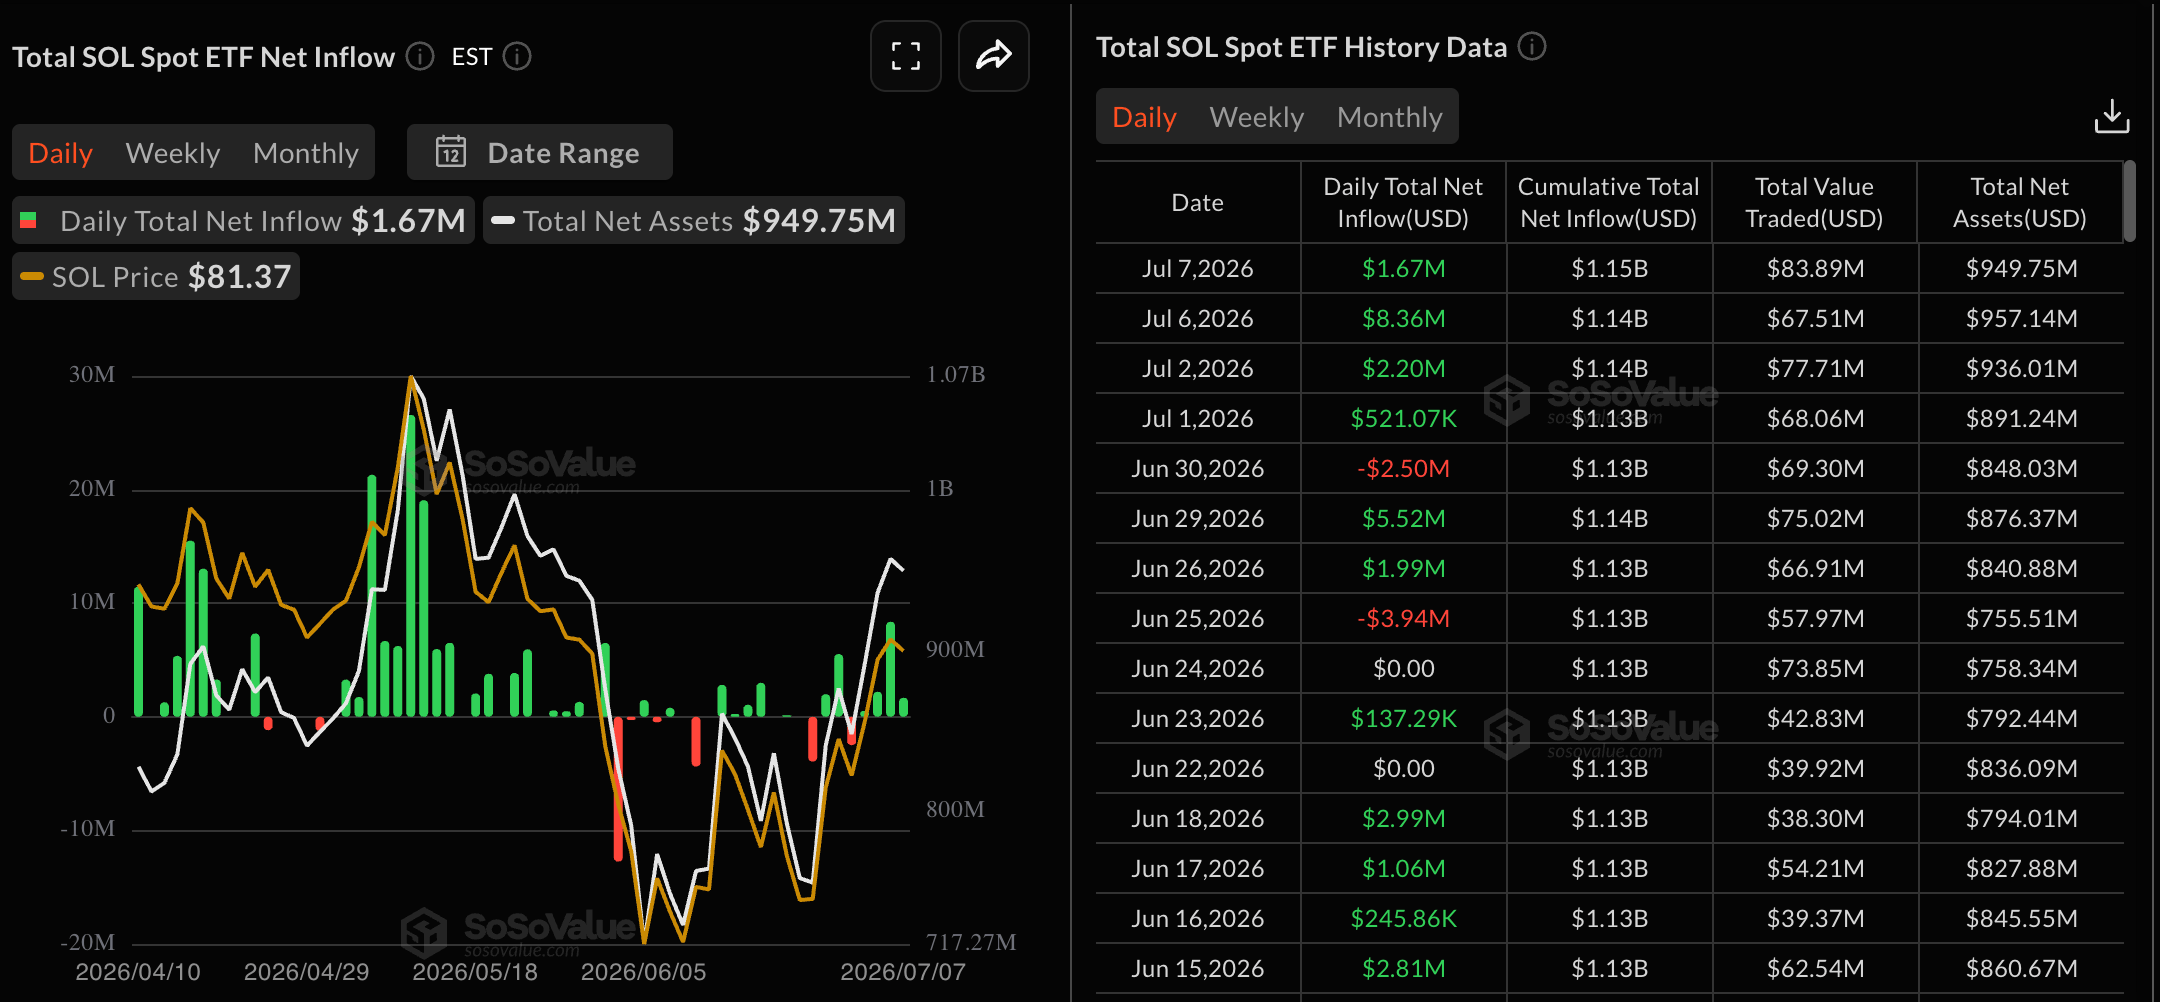
- SOL ETF inflows fell sharply to $1.67M on Tuesday, down from $8.36M on Monday
- Open Interest dropped 4% in 24 hours to $5.31 billion, showing reduced trader activity
- Analyst Ali Charts warns a rejection at the $79–$85 supply zone could push SOL toward $53
- Traders Scient and Ryker are watching the $74–$77 zone as a potential floor before any move higher
Solana (SOL) is down 3% on Wednesday, extending a pullback that began after price was rejected at a long-term overhead trendline near $83.94.
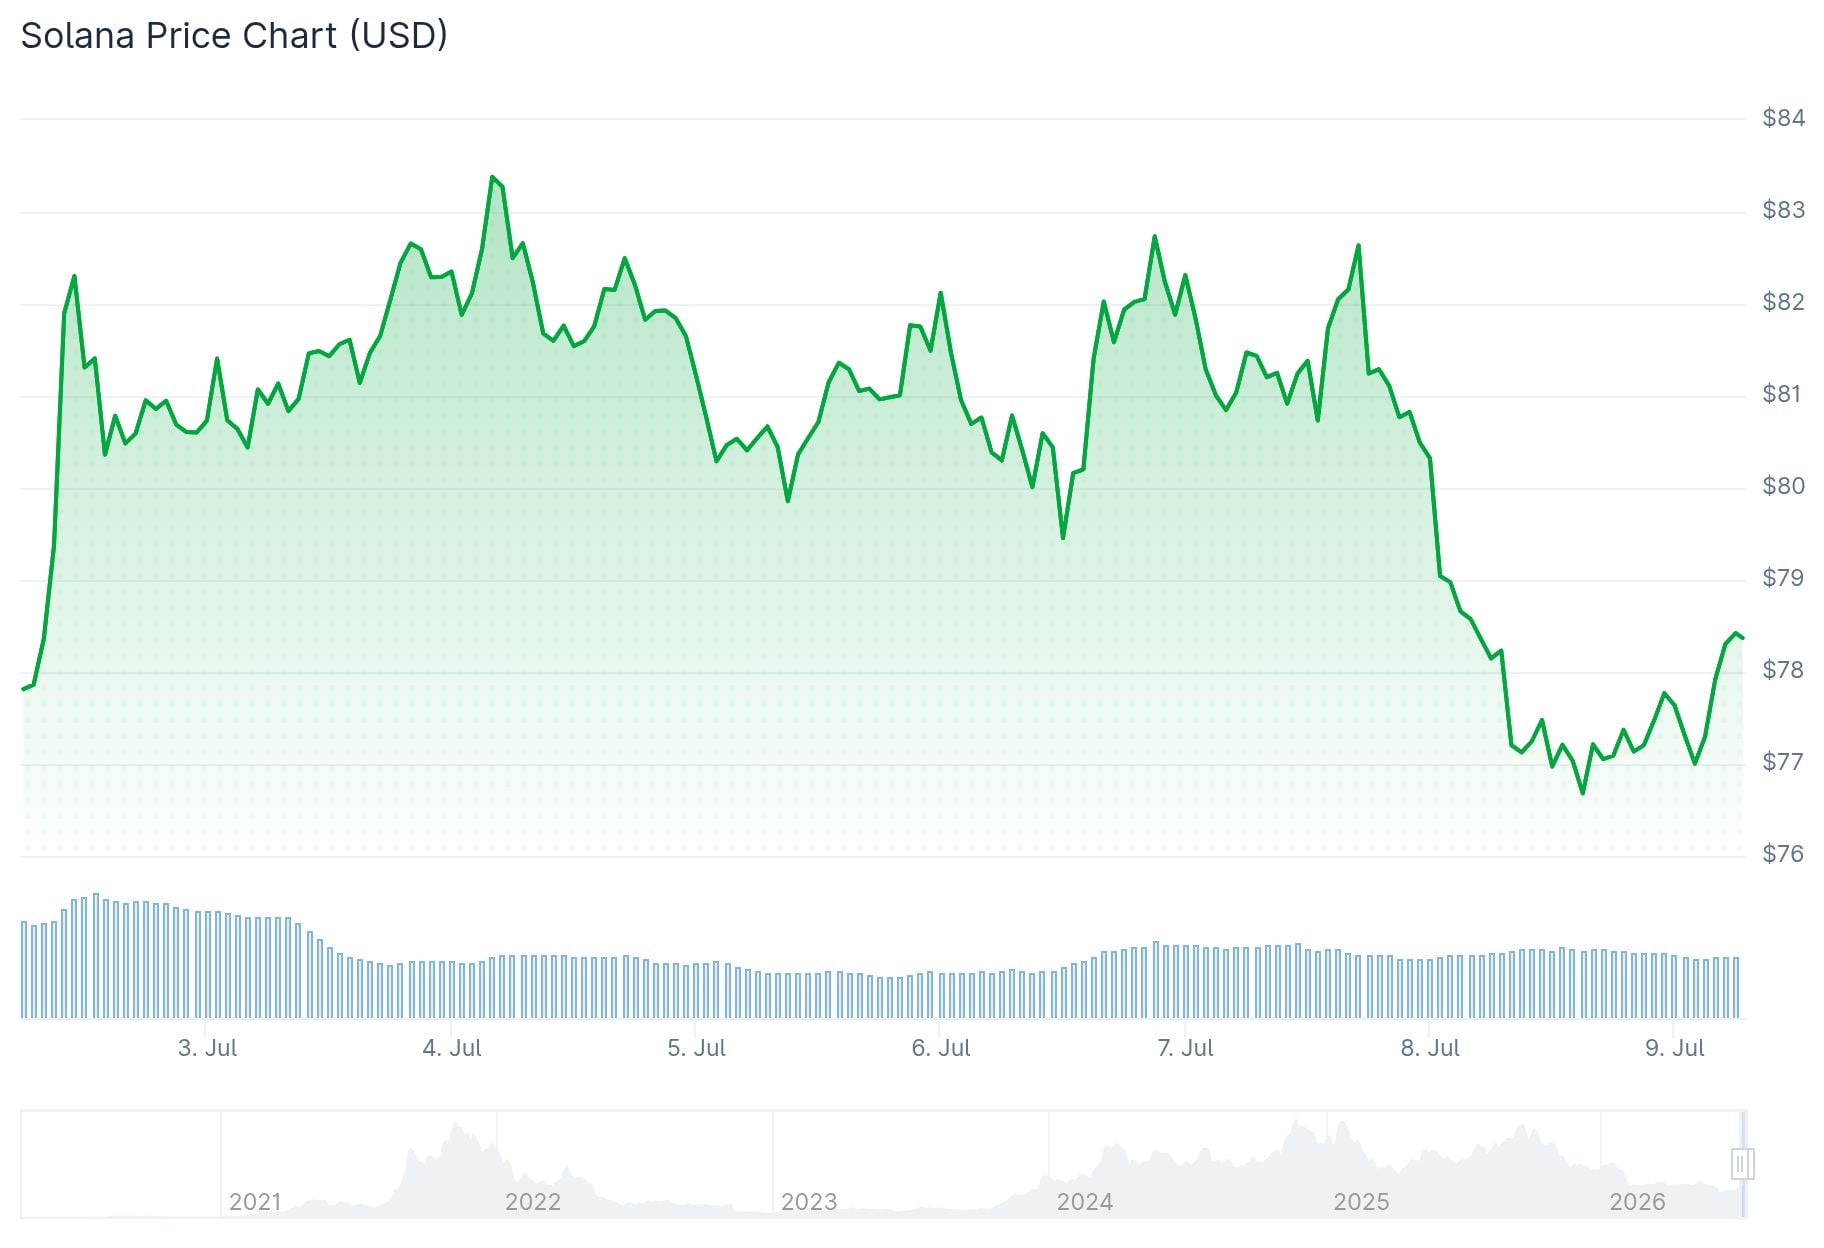
The decline brings SOL closer to a key technical support zone at $76.67, where the 50-day Exponential Moving Average (EMA) sits.
Institutional demand for SOL has softened. ETF inflows came in at $1.67 million on Tuesday, a sharp drop from $8.36 million on Monday, according to Sosovalue data.
Open Interest in SOL futures fell 4% over the last 24 hours to $5.31 billion, based on CoinGlass figures. Trading volume also dropped 8% to $8.66 billion.
Funding rates stand at 0.0029%, up from -0.0042% the previous day. That shift points to near-term indecisiveness among traders rather than a clear directional move.
SOL remains well below the 200-day EMA at $95.51. That keeps the broader trend neutral rather than outright bullish.
Bears in Control Below $83.94
The MACD is descending toward its signal line, which could trigger a bearish crossover if buying pressure continues to fade. The RSI has slipped to 54, showing that buyers are struggling to hold momentum.

The most immediate support sits at the 50-day EMA of $76.67, reinforced by the 50% Fibonacci retracement at $76.92. A close below that zone could open the door to a drop toward $60.13, about 22% lower.
Crypto analyst Ali Charts flagged a dense supply cluster between $79 and $85 on X. According to on-chain URPD data he shared, roughly 105 million SOL were transacted within that range.
SOLANA: BIG SUPPLY WALL
Solana is currently attempting to reclaim a resistance zone between $79 and $85.
According to URPD data, roughly 105 million SOL were transacted within this range, establishing a dense supply cluster.
Reclaiming this zone as support clears the overhead… https://t.co/CZXB9kPtOz pic.twitter.com/jiZI3GJ8z4
— Ali Charts (@alicharts) July 8, 2026
He noted that clearing this zone would open the path toward $100 first, then $127. But a rejection there could accelerate selling, pushing SOL toward $53.
Traders Watch $74–$77 as a Key Floor
Trader Scient said he started adding to his SOL position after price pulled back into the $74–$77 zone. He described the area as a former breakout zone and placed bids down to $74.
$SOL, Took a few days but price has now reached the support/RLs/breakout zone.
Started adding size to position again at the support.
Have bids till $74.
Probably another local low in the US session and then up.
Lets see.#SOLUSDT https://t.co/op0DDsh7jE pic.twitter.com/VOM9lO6L4Y
— Scient (@Crypto_Scient) July 8, 2026
If buyers defend this zone, the first upside target sits near $93. The larger target range extends between $115 and $127.
Trader Ryker is comparing the current 2026 setup to Solana’s 2023 recovery, when SOL built a base before a strong rally. He bought SOL at $40 in that cycle and sold at $122.
Ryker says he is now waiting for a cleaner entry before buying again. He believes the setup may need more time to form before the next move higher develops.
SOL ETF inflows on Tuesday came in at $1.67 million, the lowest reading in two days.


