






TLDR
- Solana ETF inflows hit $8.8 million, a three-month high
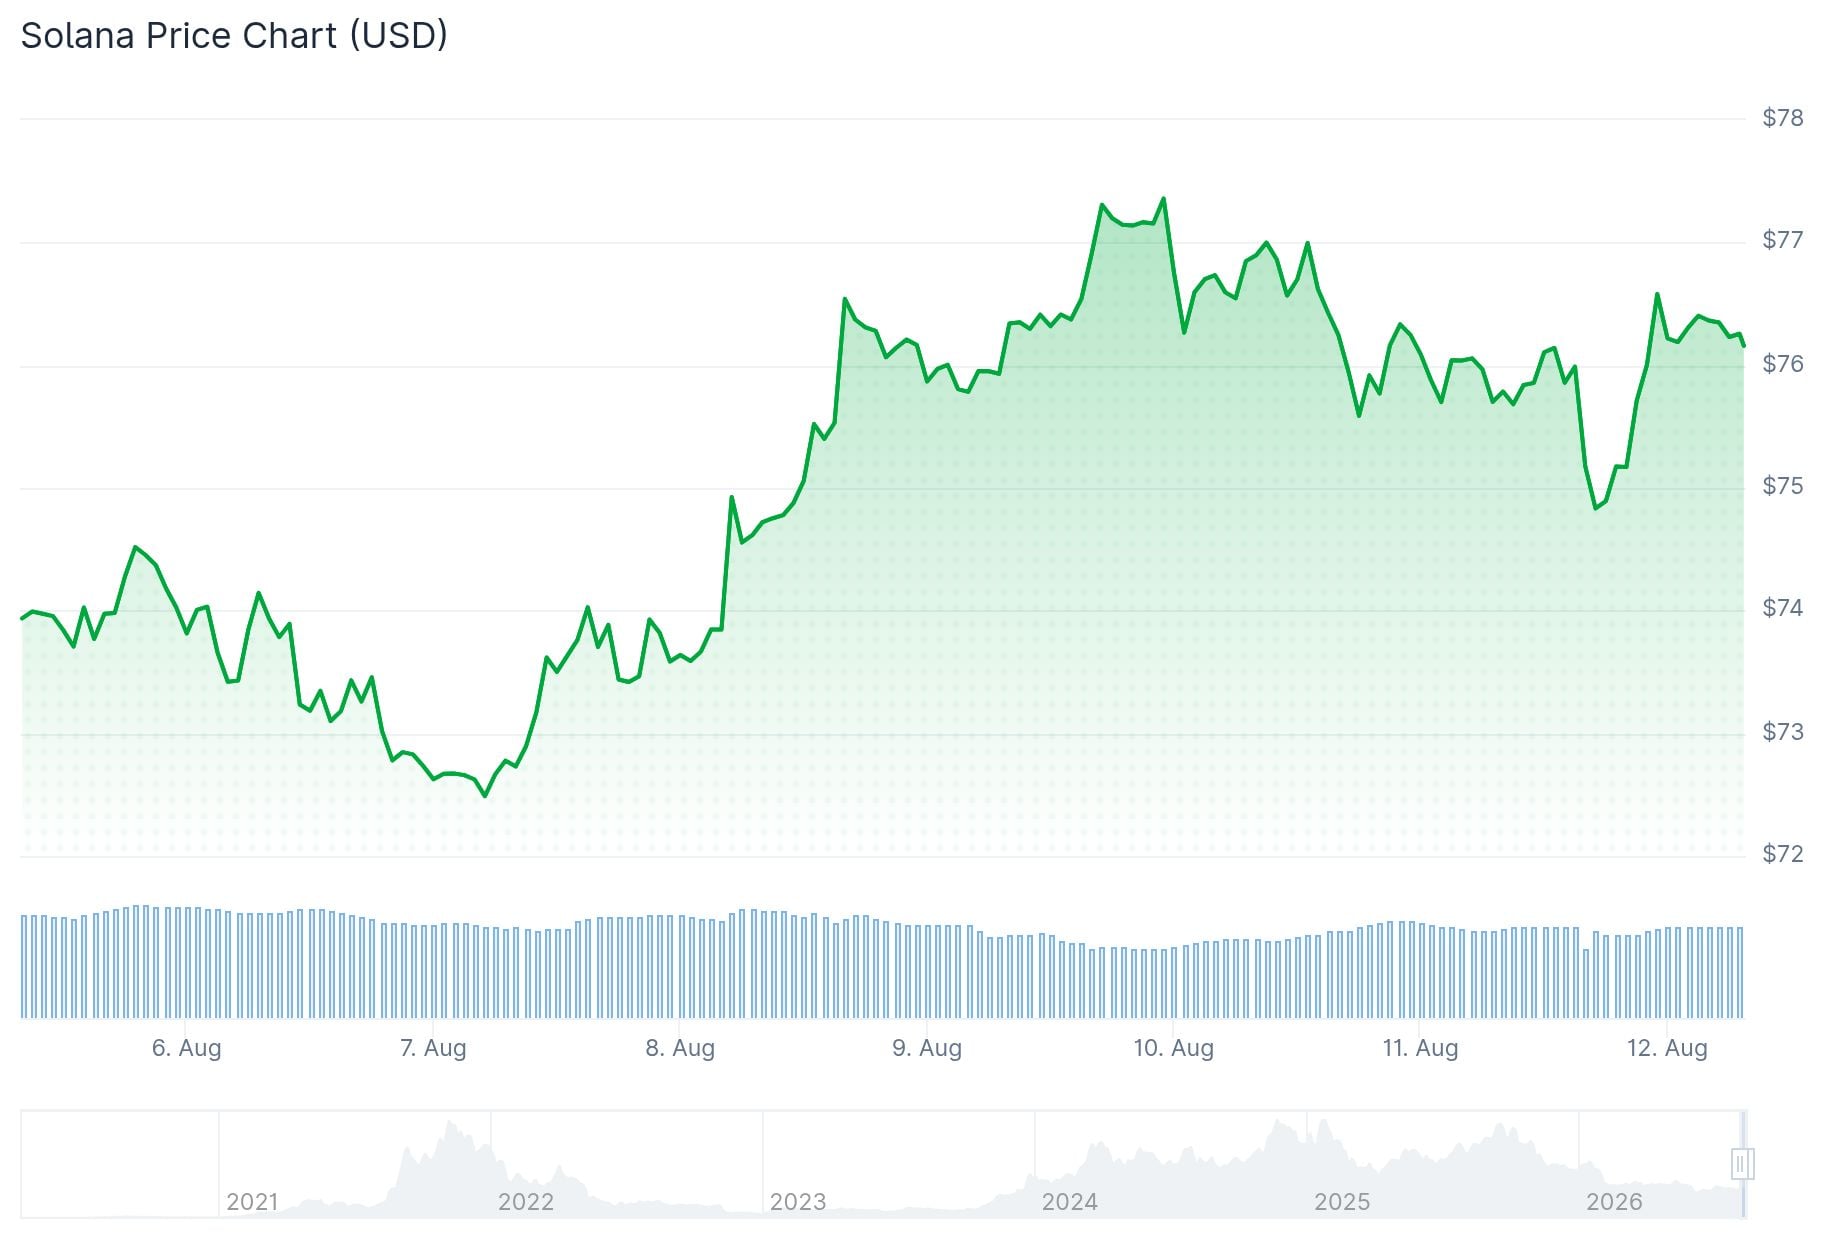
- SOL fell 1.16% to $74.88 on Tuesday despite a 7-day positive run
- Key resistance levels sit at $77, $90, and $100; support at $74
- MoneyGram expanded its Ramps service to Solana, adding cash-to-crypto access across 170+ countries
- Analyst Bluntz sees a weekly bull divergence on SOL, suggesting a potential bottom
Solana (SOL) dropped 1.16% to $74.88 on Tuesday, giving back some of its gains from the prior seven days. The broader crypto market also slipped, with total market cap falling 0.6% to $2.17 trillion.
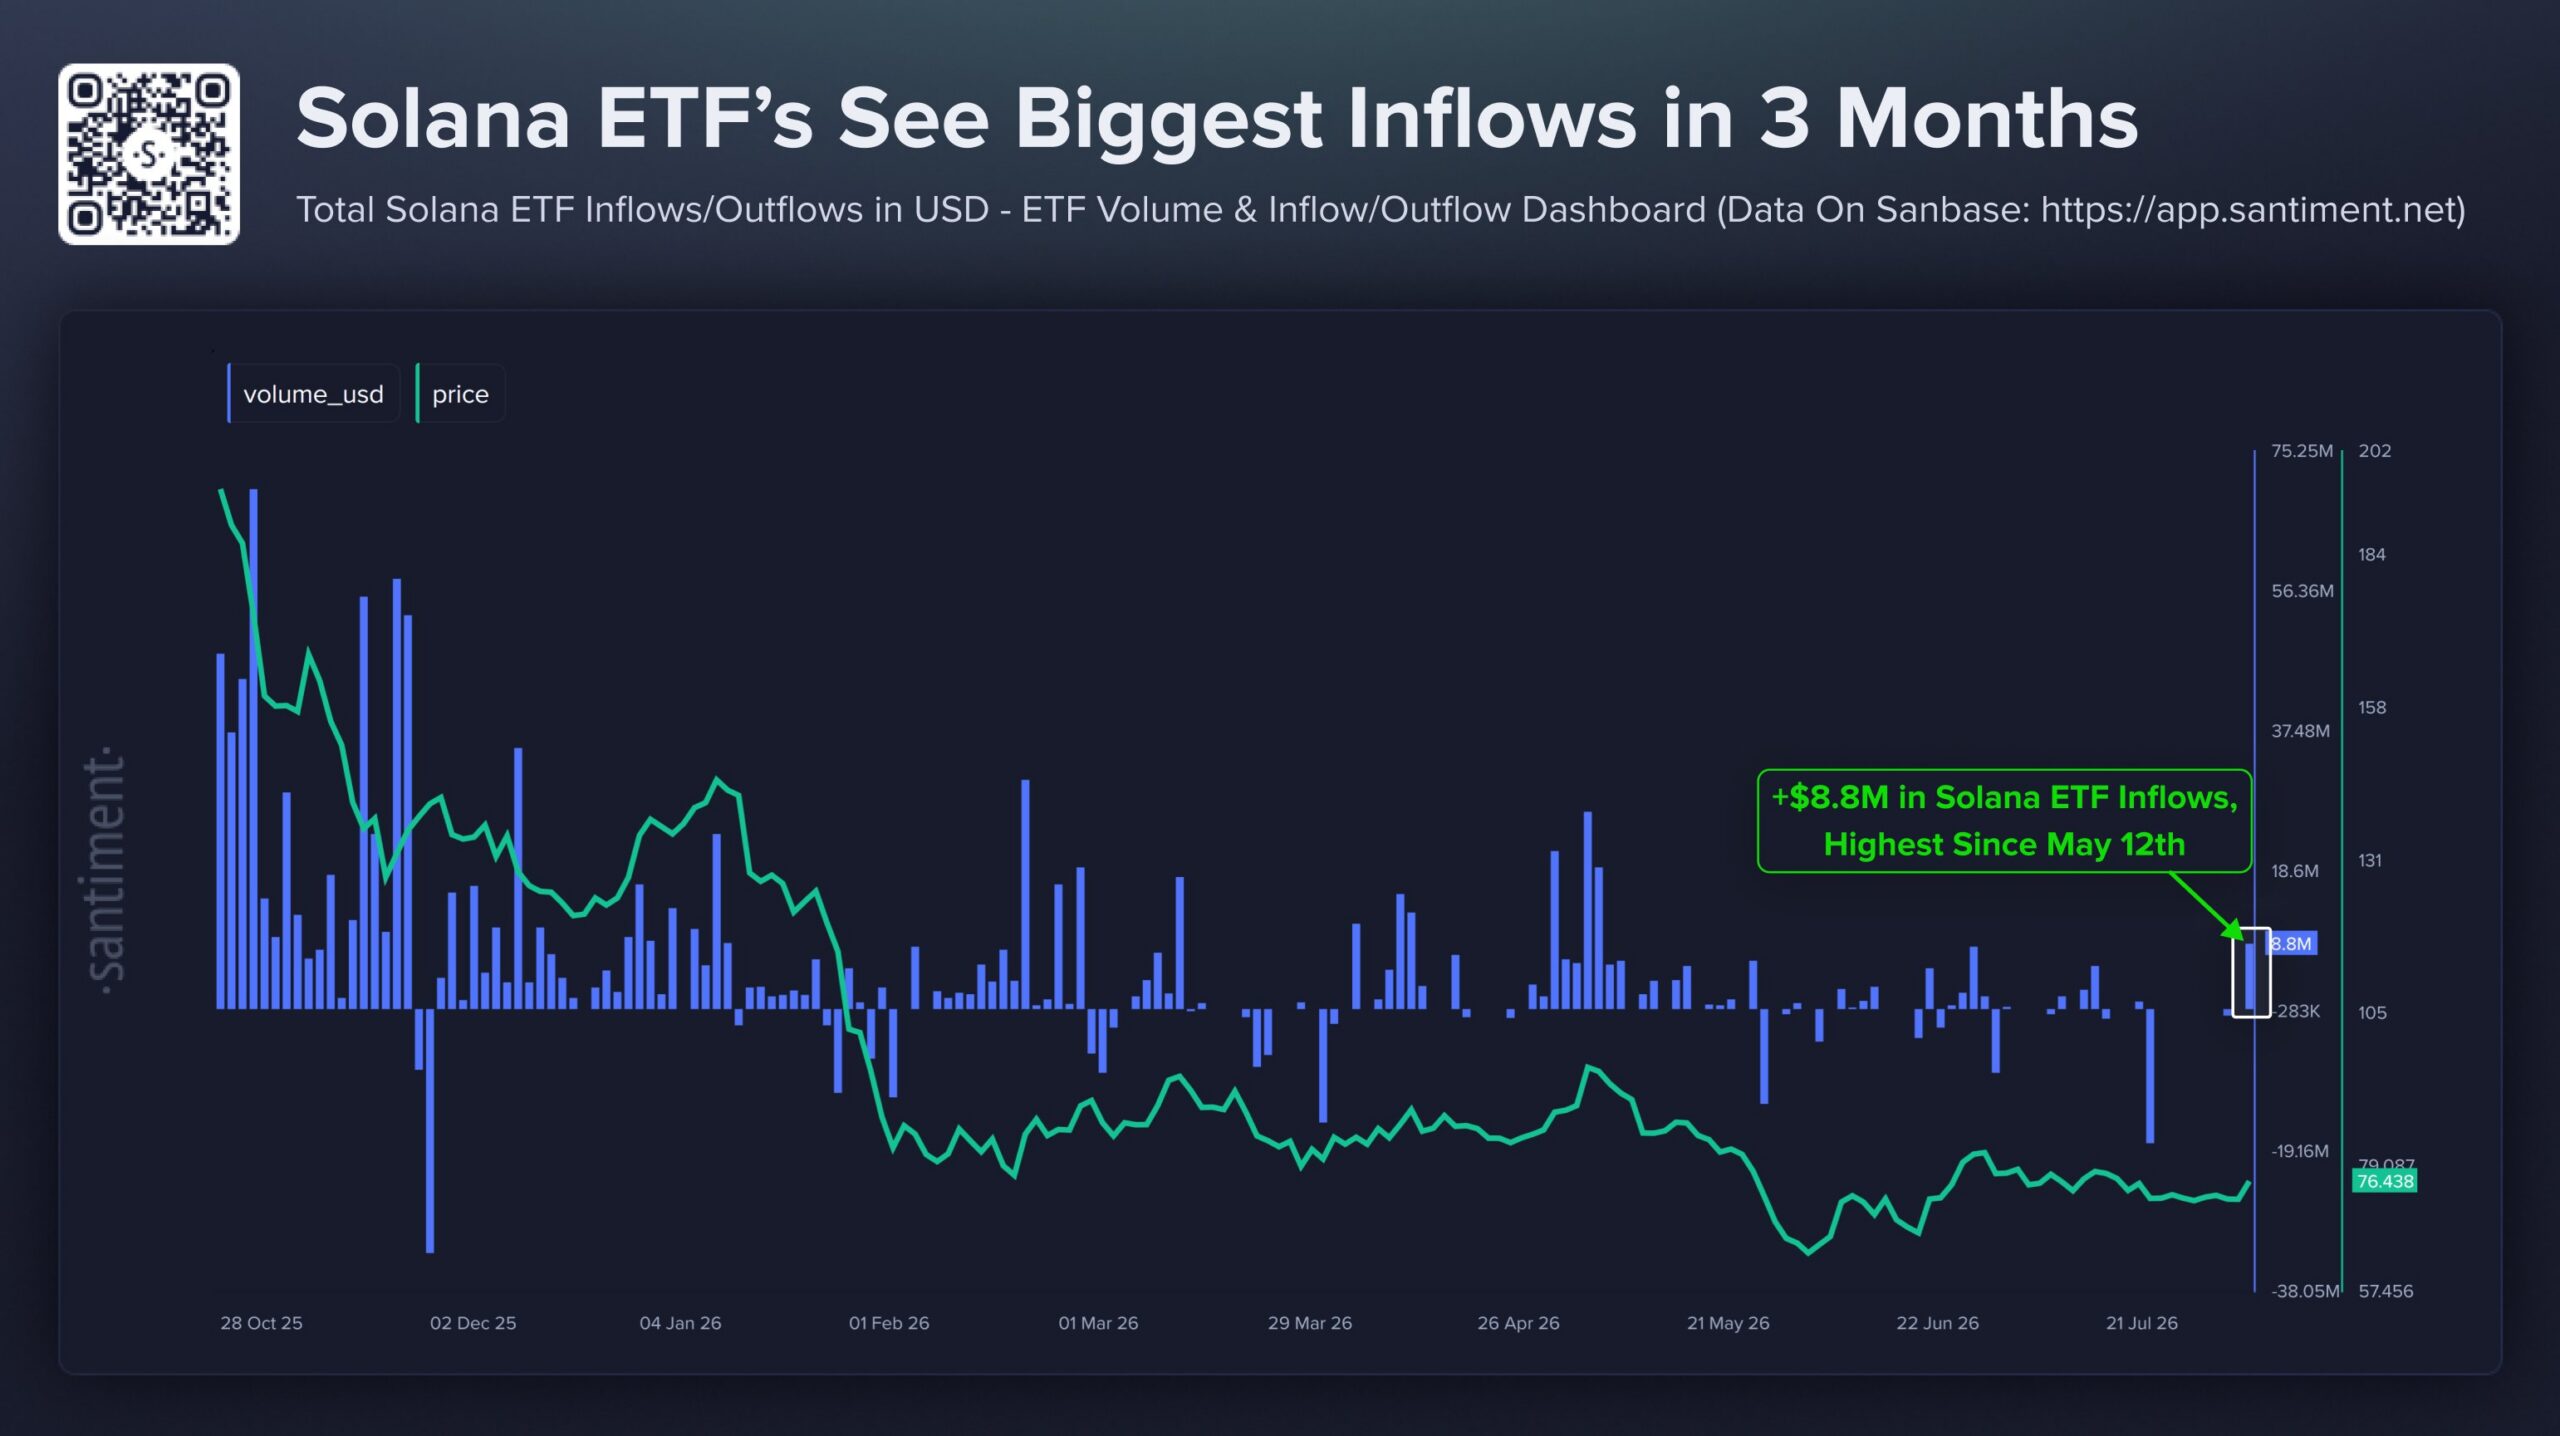
Despite the price dip, Solana ETFs recorded net inflows of $8.8 million — the highest since May 12, according to Santiment data. The inflow came while SOL was trading around $76.44, suggesting renewed institutional interest even as market conditions remain uncertain.
ETF flows have not been consistent, with some recent sessions seeing small outflows. But the latest figure stands out as the strongest in three months, topping activity seen throughout June, July, and early August.
MoneyGram Brings Cash Ramps to Solana
On August 11, MoneyGram announced it expanded its Ramps service to Solana. The service, previously only available on Stellar, now allows Solana wallets, exchanges, and developers to offer cash-to-crypto and crypto-to-cash conversions.
BREAKING: @MoneyGram Ramps is live on Solana.
60M+ customers, nearly 500,000 retail locations, 170+ countries. One of the world's largest payments networks is now a single API away for every builder on Solana. pic.twitter.com/TSOhIpBjvz
— Solana (@solana) August 11, 2026
Rift became the first Solana wallet to integrate MoneyGram Ramps. MoneyGram serves over 60 million customers through nearly 500,000 retail locations in more than 170 countries.
Ramps supports cash deposits in over 25 countries and withdrawals in over 170 countries and territories. Developers can access it through the Solana Developer Platform’s payments module without building their own banking infrastructure.

MoneyGram had already become a Solana validator in June, staking SOL and processing transactions on the network.
Technical Picture
On the four-hour chart, SOL briefly pushed to $77.40 before sellers pushed it back down toward $75. The MACD line sits at 0.19, below the 0.46 signal line, with the histogram at -0.27, pointing to short-term bearish pressure.
The RSI has dropped to 44.46, below the 50 neutral level, indicating declining demand. SOL needs to hold $74 to avoid a move toward $73 or $72.
Crypto analyst Bluntz (@Bluntz_Capital) noted on X that SOL is showing “strong price action” and pointed to a weekly bull divergence that may mark the bottom. He described the current phase as an accumulation period.
strong pa on $SOL here, liking it alot, its been somewhat boring because we are likely still in an accumulation period but ppl have already conveniently forgotten theres a weekly bull div there likely marking the bottom pic.twitter.com/WQZCJ4zaOG
— Bluntz (@Bluntz_Capital) August 11, 2026
A recovery above $75 would be the first sign of renewed buying interest, with $76 and $77 as the next resistance levels. Above $90, the path to $100 opens up.
SOL was last trading at $78.33.


