


 Price: This Has Never Happened Before in SOL’s History — And Analysts Are Watching Closely")


TLDR
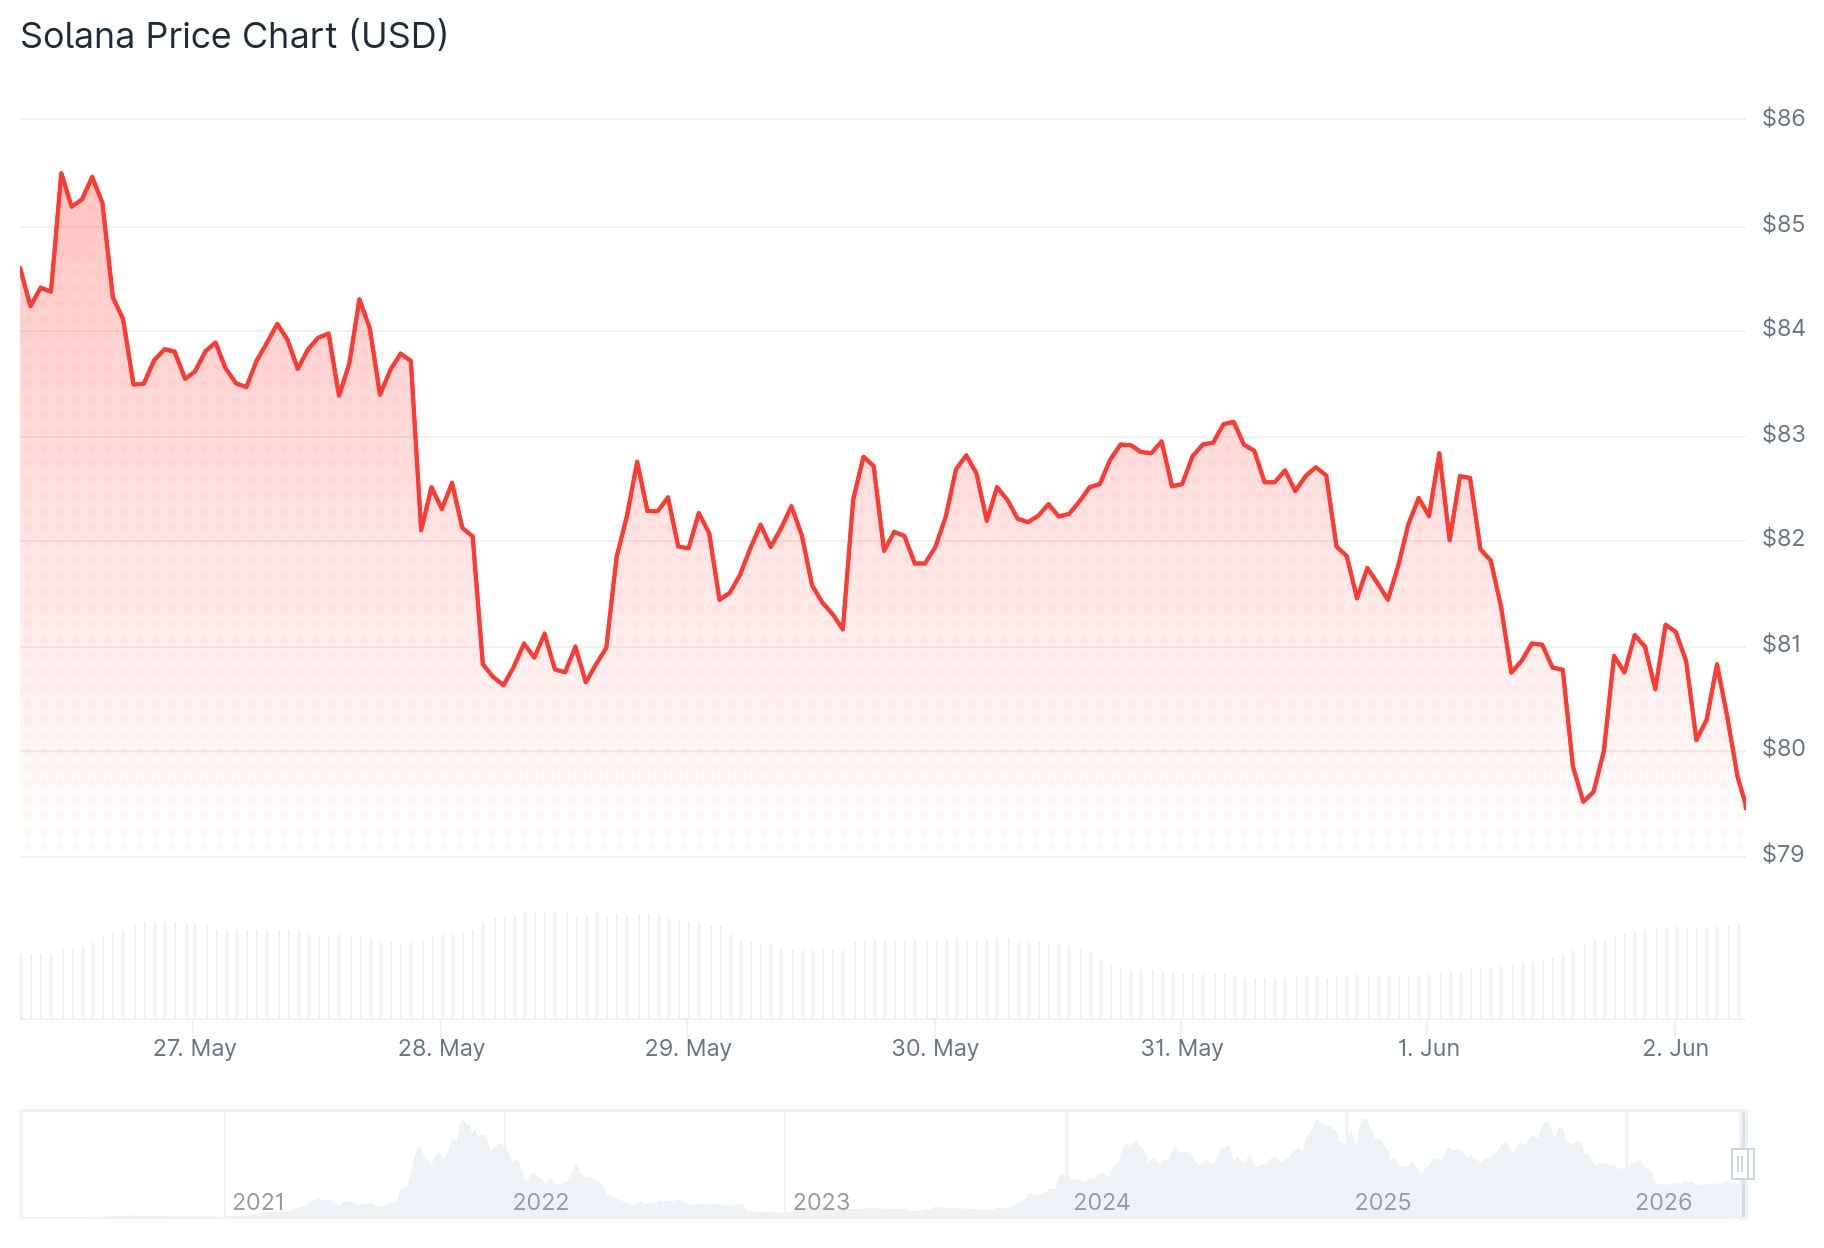
- SOL is trading near $79.50, stuck in a range between $76 and $90 for several months
- Active users have dropped from 3 million to below 2 million; DEX volume and Open Interest are also falling
- A cluster of short liquidations sits between $83–$87, which could spark a quick rally if triggered
- Analyst Crypto Patel points out SOL has never printed 8 consecutive red monthly candles before — mirroring a pattern from the 2021 bear cycle
- Key support sits at $68.02; a break below that level would invalidate the current bullish chart structure
Solana has been grinding lower for months, and the on-chain data is starting to reflect that. The token is currently trading around $79.50, trapped inside a range that has held since early this year.
Active users on the Solana network have dropped steadily from nearly 3 million earlier in 2025 to around 1.9 million now. That’s a meaningful drop in real usage.
DEX trading volume has also fallen sharply from its peak earlier this year. Billions in daily volume have dried up, and that trend has not reversed.
Network and Derivatives Data Both Weaken
Open Interest in Solana derivatives has slipped from a high near $3 billion down to roughly $2.1 billion. Traders are closing positions and pulling back on leverage.
What’s unusual is that funding rates are still positive. That means traders are still leaning bullish, even as the data behind the trade looks weaker.
On the technical side, analyst Man of Bitcoin is watching a squeeze play out on the four-hour chart. SOL is being pinched between a descending and a rising trendline, and he says a breakout is getting close. The level he’s flagging: $68.02. If SOL falls below that, the bullish chart structure breaks down.
$SOL: The price is getting squeezed between both trendlines. A break out is imminent.
Key level to keep the ABC roadmap to the upside intact is at $68,02. pic.twitter.com/x9hupg6Uil— Man of Bitcoin (@Manofbitcoin) May 31, 2026

If SOL breaks higher, resistance sits near $98, with further targets at $110.54, $120.47, and $126.95.
Analyst CryptoCurb shared a long-term weekly chart showing Solana building a wide consolidation base between 2024 and 2026. His projected target is $1,000, but the setup still needs confirmation above the top of the current range.
Crypto Patel Flags a Historic Pattern
Analyst Crypto Patel posted a detailed breakdown on X, flagging something that has never happened in Solana’s history: 8 consecutive red monthly candles.
$SOL Just Made History And It's Worth Paying Attention To ( Must Read )
For The First Time In Solana's Existence, #SOL Has Printed 8 Consecutive Red Monthly Candles.
That Has Never Happened Before. Let That Sink In.
1️⃣ A Look Back → The 2021 Cycle
After Solana Topped At Its… pic.twitter.com/1IKuqT7gf5— Crypto Patel (@CryptoPatel) June 2, 2026
He pointed back to the 2021 bear cycle, where Solana fell from $260 all the way to $8. That decline also produced 9 red monthly candles — but not consecutive ones. The 9th candle marked the bottom, and SOL went on to reach a new all-time high near $295 over the following two years.
Patel says the 9th monthly candle is forming now, and he’s watching the $80–$50 zone as a potential accumulation range. If the pattern from last cycle repeats, he projects SOL could target a new all-time high somewhere between $500 and $1,000 over the next one to two years.
On the shorter timeframe, liquidation data from Coinglass shows a cluster of short positions stacked between $83 and $87. If SOL climbs into that zone, forced buybacks could push the price higher quickly.
Key downside level remains $76. Key upside trigger sits at the $83–$87 short liquidation zone.


