


 Price: Bulls Eye $95 as Bollinger Bands Signal a Big Move Is Coming")


TLDR
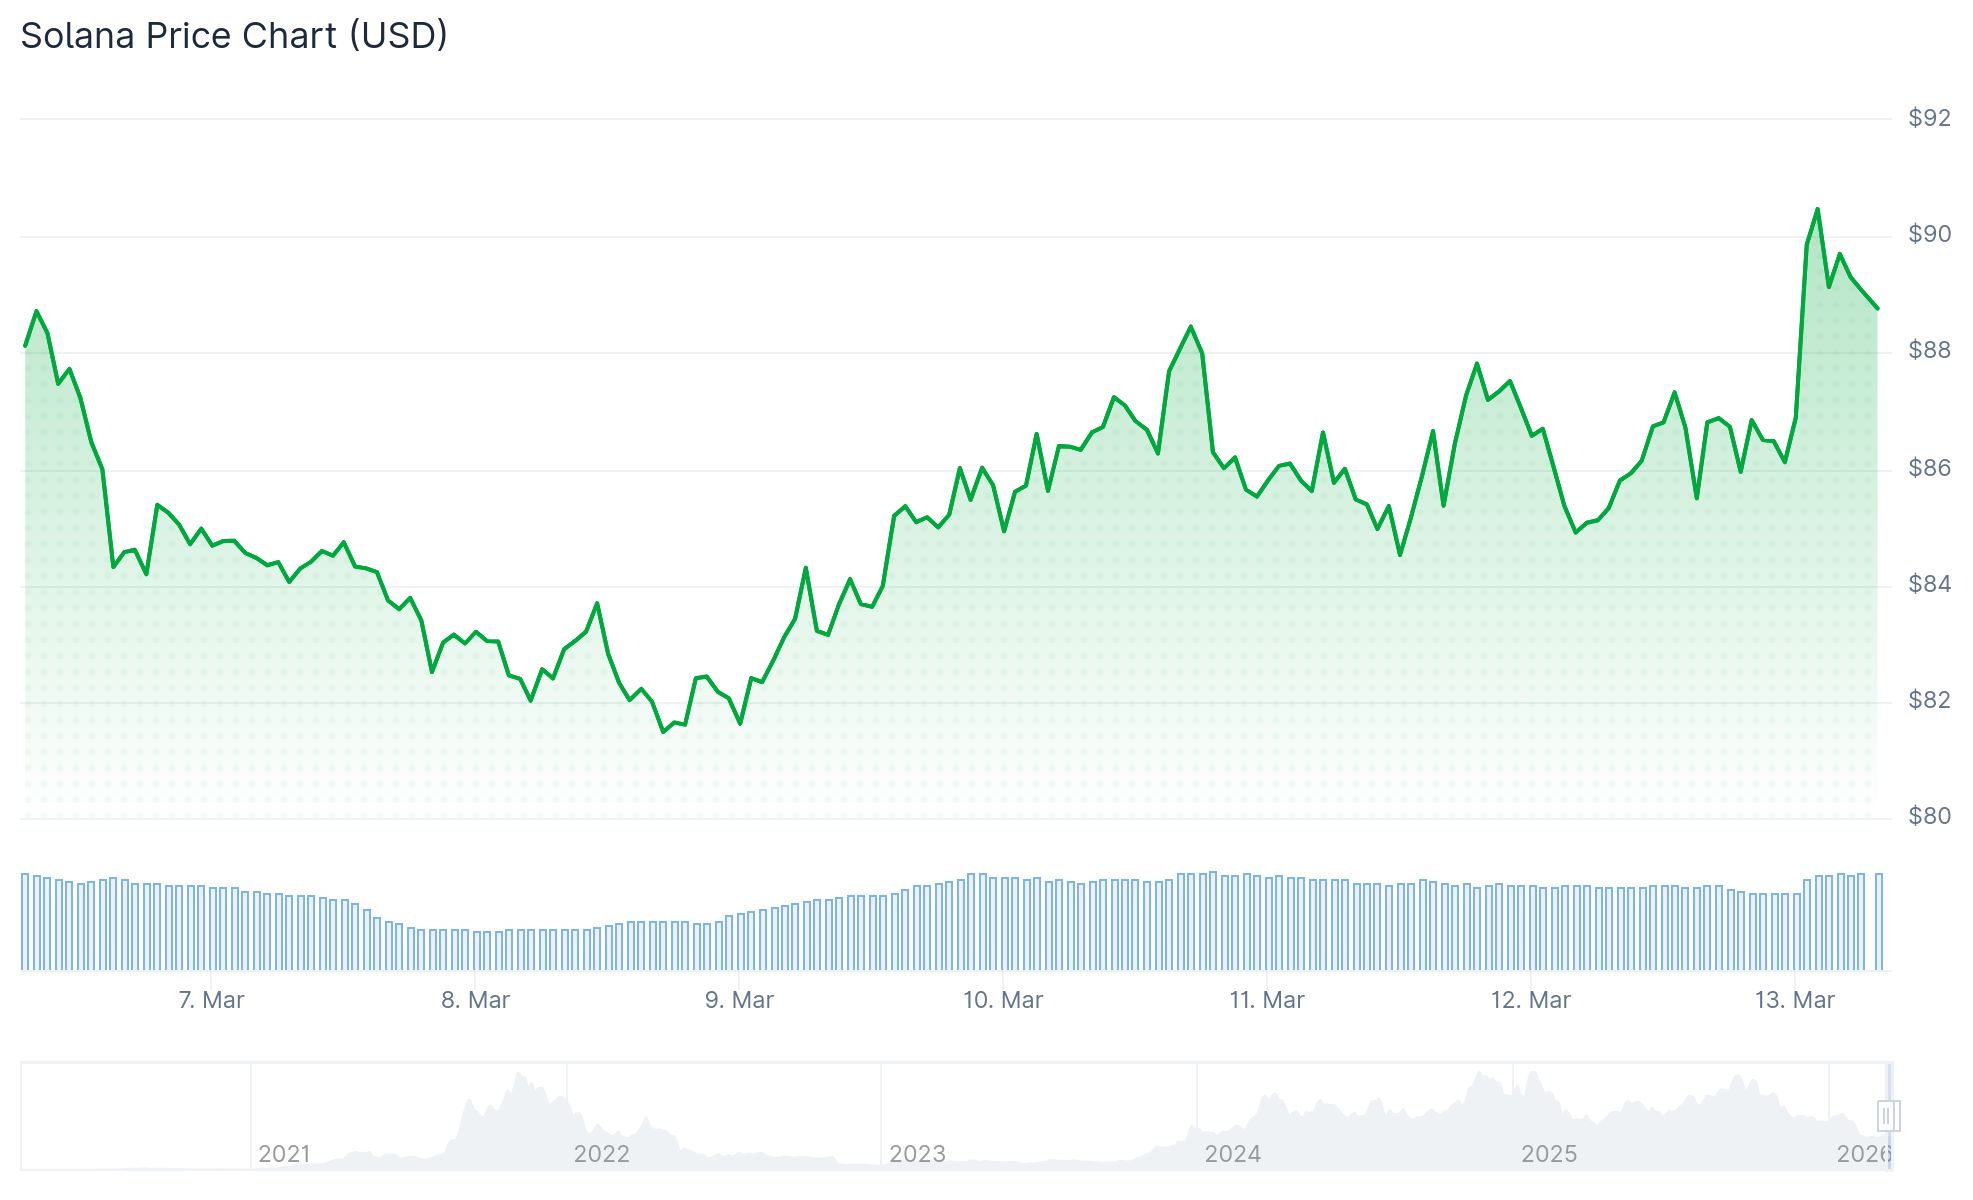
- Solana is trading around $88–$90 after a 10% gain this week
- A Bollinger Bands squeeze on the daily chart points to a coming volatility move
- $95 is the key resistance level that could shift the broader trend
- Spot SOL ETFs saw $3.92 million in inflows on Thursday, the fifth straight week of positive flows
- Derivatives data shows bullish sentiment with long bets at a monthly high
Solana (SOL) is trading near $90 as of March 13, 2026, up close to 10% over the past week. The price has been moving sideways inside a descending channel that has kept SOL between roughly $77 and $92 for several weeks.
On the daily chart, the Bollinger Bands are squeezing inward, which means volatility has been falling after a sharp drop from above $130. This kind of squeeze often comes before a stronger price move, though the direction is not yet confirmed.
Bollinger Bands squeeze on Solana $SOL suggests a major price move could be coming soon. pic.twitter.com/O2VbMe7eQ2
— Ali Charts (@alicharts) March 11, 2026
SOL recently broke above a contracting triangle on the hourly chart, clearing the $87 resistance level. Price pushed to a high of $91.12 before pulling back slightly. The coin is now holding above $88 and the 100-hour simple moving average.
$95 Resistance Is the Level to Watch
Analysts have identified $95 as the most important level for Solana right now. This area sits at the intersection of a descending trendline and a previous horizontal resistance zone.
Call me crazy but I still believe in 1.2K $SOL -> Weekly RSI is at bear lows & everyone is calling for $20!
Time is impossible to predict but based on my macro view + fib times; best guess would be 2027-2028!
Not financial advice! #SOL pic.twitter.com/kIlqpqppak
— Vuori Trading (@VuoriTrading) March 9, 2026
If SOL closes above $95 and holds it, the technical structure could shift from a downtrend to an upward phase. A confirmed break would open the door toward the $98–$100 range, with $102 as the next level after that.

If SOL fails to hold above $88, initial support sits at $87.40. A break below $85 could send the price back toward the $77 area, which is the lower boundary of the current channel.
ETF Inflows and Derivatives Support the Bullish Case
Institutional interest in Solana is growing. Spot SOL ETFs recorded $3.92 million in inflows on Thursday, following $1.66 million the day before. Weekly flows total $3.10 million, making it the fifth straight week of positive inflows since February 13.

Funding rates flipped positive on Thursday, reading 0.0079%. This means traders with long positions are paying those on the short side, which reflects bullish sentiment.
The long-to-short ratio for SOL reached 1.07 on Friday, the highest level in over a month. A reading above 1.0 means more traders are betting on a price increase than a decline.
The RSI on the daily chart has climbed above 50, showing improving momentum. The MACD remains in positive territory with the signal line confirming recovering bullish pressure.
Solana’s spot ETFs have now posted five consecutive weeks of positive inflows since February 13, according to SoSoValue data.


