


 Price: Bears Are in Charge as Bearish Chart Pattern Forms")


TLDR
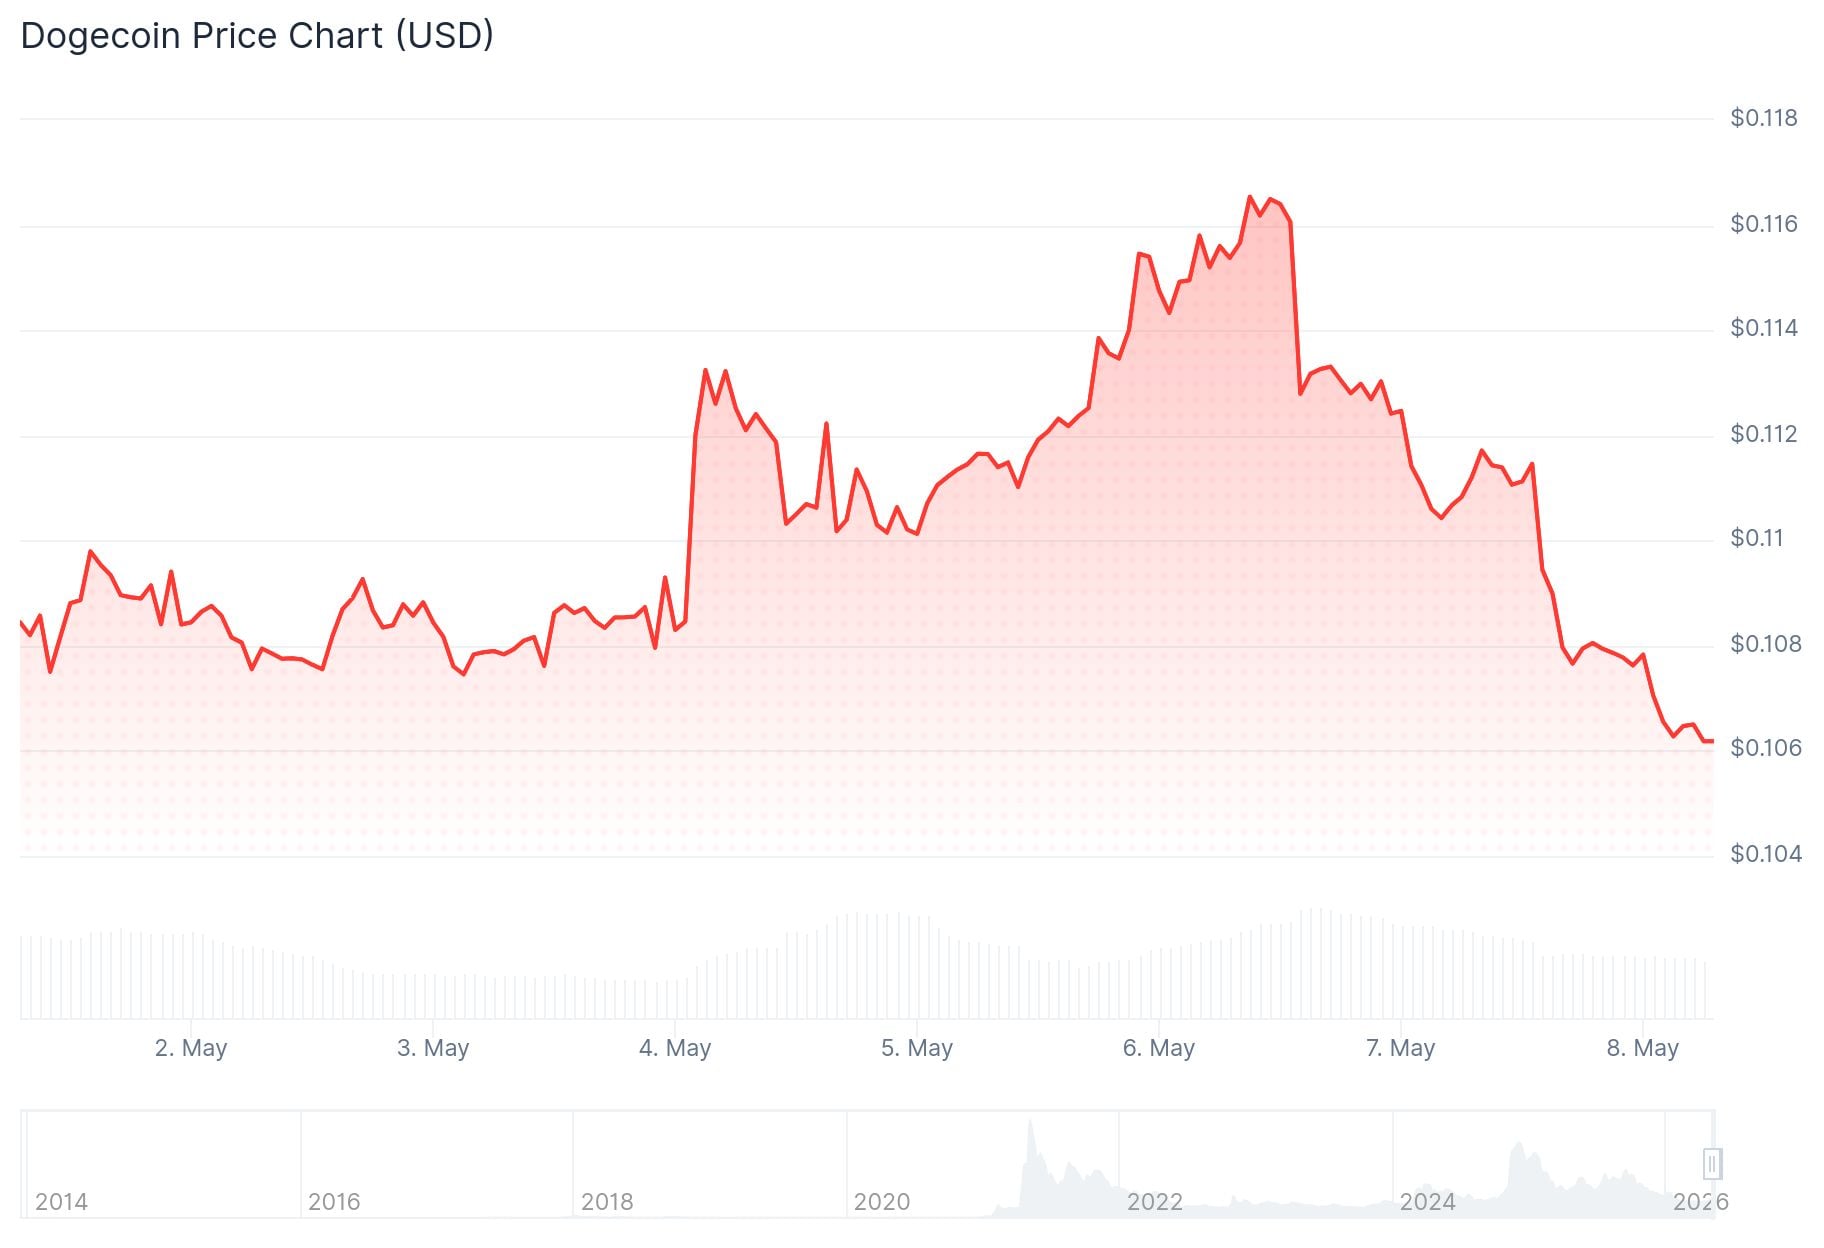
- Dogecoin dropped 4.62% to around $0.106, trading below key moving averages
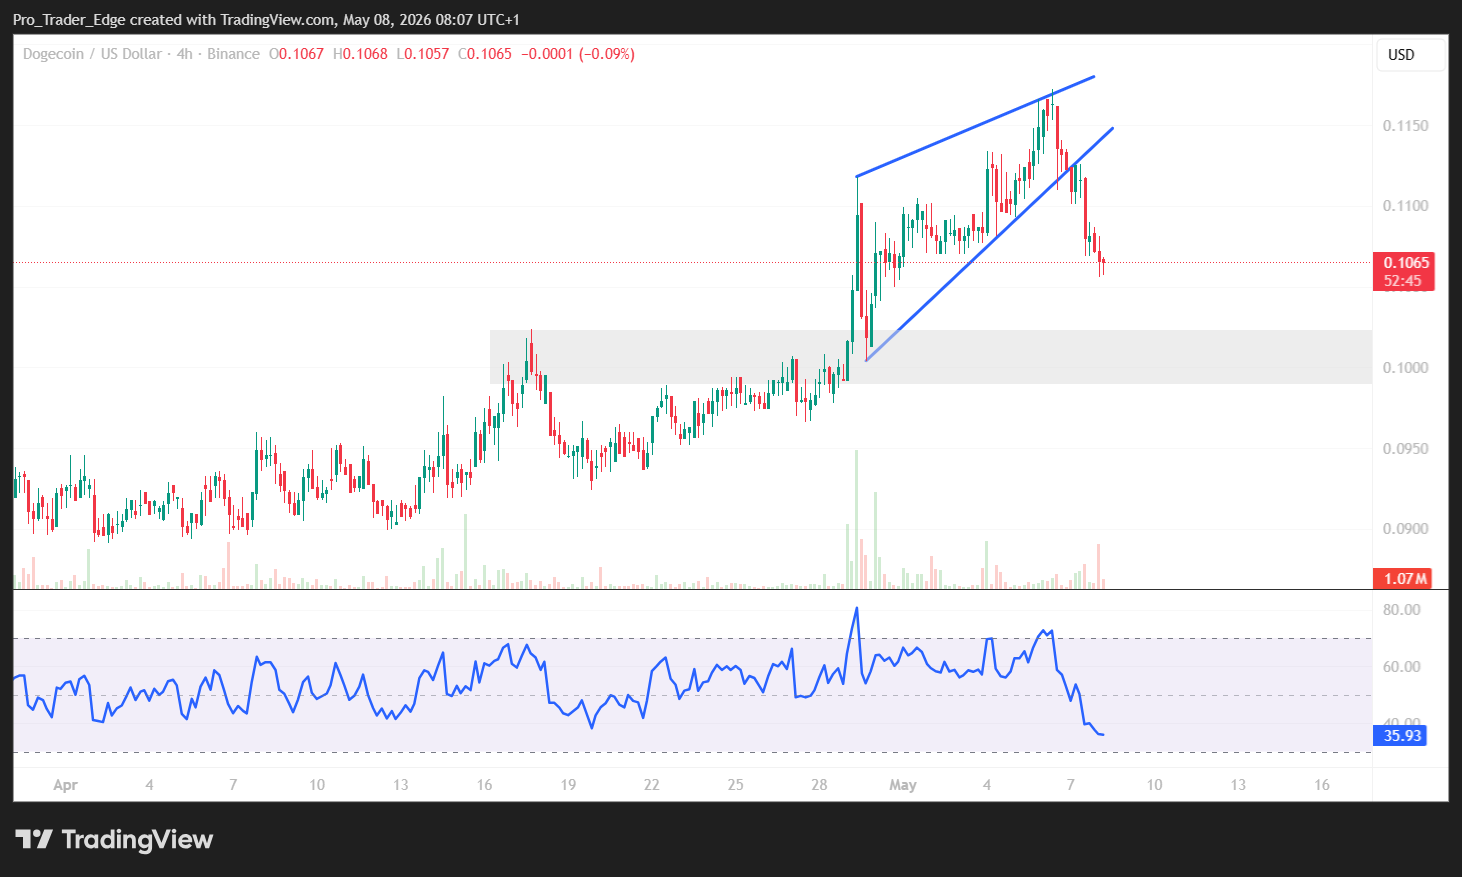
- A rising wedge pattern on the 4-hour chart points to possible further downside
- DOGE ETF inflows returned May 5–6, totaling over $600,000 after a week of no activity
- Key support sits at $0.10; a break below could push price toward $0.088–$0.082
- Resistance levels to watch are $0.1085, $0.1115, and $0.1132
Dogecoin is under pressure this week after dropping over 4% to trade around $0.106. The price slipped below the $0.110 level and the 100-hourly simple moving average, putting bulls on the defensive.
A rising wedge pattern has formed on the 4-hour chart. This pattern often signals that a price drop is coming. The wedge suggests DOGE could fall toward $0.103 if it breaks below the lower trendline.
Technical indicators are also leaning bearish. Both the Chaikin Money Flow (CMF) and the Relative Strength Index (RSI) are trending downward, showing bears are gaining control.
Key Resistance Levels to Watch
On the upside, DOGE faces immediate resistance at $0.1085, where a bearish trend line sits on the hourly chart. A move above that opens the door to $0.1115, which lines up with the 50% Fibonacci retracement of the recent swing from $0.1172 down to $0.1058.
A close above $0.1115 could push price toward $0.1132 and then $0.1145. Bulls would need a strong push past these levels to change the short-term outlook.
Despite the price weakness, DOGE ETFs saw renewed buying interest. After zero inflows between April 28 and May 4, flows returned on May 5 and 6, bringing in more than $600,000.
DOGE ETFs launched last year, marking the first time a meme coin reached Wall Street. Unlike Bitcoin ETFs, which see daily activity, DOGE ETFs can go days with no trades at all. The recent return of inflows shows some institutional interest remains, even during the price dip.

Support Levels That Could Determine the Next Move
The $0.10 level is the key line in the sand. It’s a psychological support zone, and holding it matters. If DOGE breaks below $0.10, the next targets are $0.088 and then $0.082.
Initial support before that sits at $0.1050, followed by $0.1020. These levels will be watched closely in the coming sessions.
DOGE tends to move in line with Bitcoin. Bitcoin recently climbed to around $82,000, which could provide some support for DOGE if momentum continues.
The price formed a recent low near $0.1058 and is currently trading below the 23.6% Fibonacci retracement level of that same downward move.
As of May 8, DOGE is trading below $0.1085 and the 100-hourly moving average, with bears holding the short-term edge.


