


 Price: Whales Are Accumulating — Is DOGE Setting Up for Its Next Big Move?")


TLDR
- DOGE is trading at around $0.1109, up 1.47% in 24 hours with a $18.56 billion market cap
- Analyst BitGuru says DOGE is holding above key support and could push toward $0.12
- RSI sits at 63.10 and MACD shows positive momentum, both pointing bullish
- Analyst Crypto Patel warns of a possible dip to $0.07 before a longer-term rally to $1, $2, or $5
- Whale on-chain activity hit a six-month high in early May, with most moves being accumulation
Dogecoin is holding above key support levels and showing bullish technical signals, with analysts watching a potential move toward $0.12 in the near term.
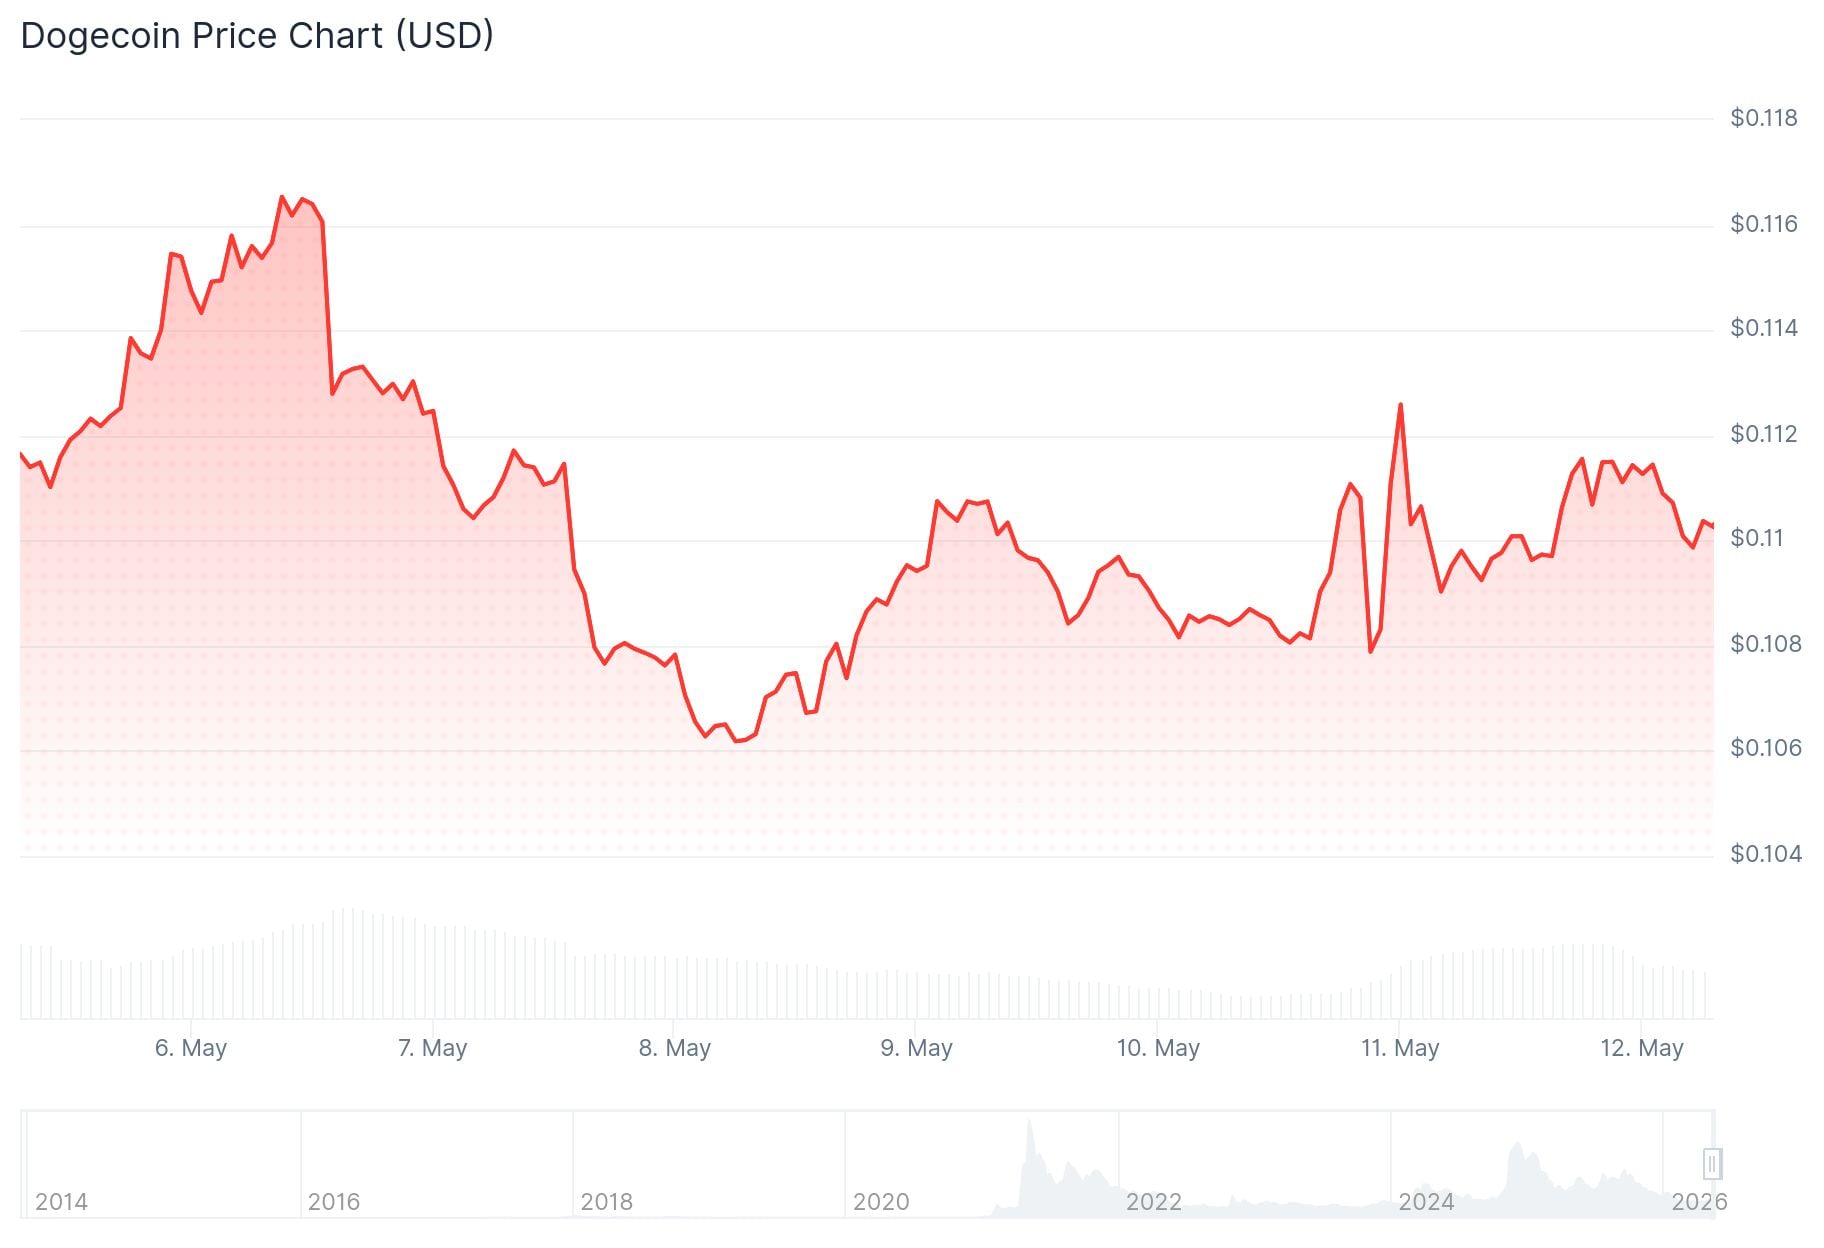
At the time of writing, DOGE is trading at $0.1109, up 1.47% over the last 24 hours. Daily trading volume stands at $3.21 billion, and the total market cap is $18.56 billion, according to CoinMarketCap.
Crypto analyst BitGuru posted an optimistic take on DOGE’s price action on X, saying the coin had been range-bound for a while before bouncing higher after clearing liquidity below support. BitGuru noted that DOGE is now trading above key support areas, and if buyers hold those levels, the next target is $0.12.
$DOGE is slowly recovering after a long consolidation phase. Price is holding above key support after sweeping liquidity, and momentum is starting to build again.
If buyers stay active, DOGE could move toward the next resistance zone soon. pic.twitter.com/k39Cqp1QmR
— BitGuru 🔶 (@bitgu_ru) May 11, 2026
The Relative Strength Index (RSI 14) is at 63.10, above the neutral 50 level, showing buyers are currently in control. DOGE is also trading above several moving average ribbon support zones at $0.10549, $0.09814, and $0.09723.
MACD Signals Buying Pressure Persists
The MACD line is at 0.00403, above the signal line at 0.00385. The histogram shows a positive value of 0.00019, meaning buying pressure is still present even though momentum has slowed slightly from earlier sessions.
If trading volumes continue to rise, analysts see a realistic chance DOGE could challenge $0.12 resistance within days. A break below current support levels would put that outlook on hold.

Crypto Patel’s Long-Term Chart Points to Accumulation Zone
Analyst Crypto Patel shared a broader, more cautious view using a 3-week DOGE/USD chart on TradingView that covers data from 2014 through a projected 2028. The chart uses an inverted price scale, meaning what looks like a drop is actually being read as a bullish long-term setup.
$DOGE JUST FLASHED THE SIGNAL NOBODY WANTED TO SEE
The Big Dump Has Started. A Massive Leg Down Is Loading On The HTF Chart.
But Here's The Truth Most Will Miss 👇
🟢 Accumulation Zone: $0.10 – $0.07
🟢 Targets: $1 | $2 | $5Retail Will Sell The Bottom. Smart Money Is Already… pic.twitter.com/cNlmJhz6qC
— Crypto Patel (@CryptoPatel) May 9, 2026
Crypto Patel’s analysis suggests DOGE may still need to revisit the $0.07–$0.10 range before a larger cycle begins. The analyst believes retail traders will sell the bottom while smart money accumulates.
On-chain data from early May backs up this view. Dogecoin whales recorded their busiest day in six months, with most activity pointing to accumulation rather than selling.
Crypto Patel’s long-term price targets are $1, $2, and $5 — a large move from current levels given DOGE is still down roughly 85% from its 2021 all-time high of $0.7316.
The first key checkpoint, according to Crypto Patel, is confirming daily and weekly closes above $0.10, then reclaiming resistance levels in the $0.15–$0.20 range.
As of writing, DOGE is trading at $0.109, with short-term bulls watching $0.12 and longer-term analysts eyeing the $0.07–$0.10 band as a potential accumulation floor.


