






TLDR
- ETH has fallen 12.6% in 30 days, the worst drop among the top 5 cryptos.
- ETH dipped below the $2,000 psychological level, with a session low of $1,964.
- Long liquidations hit $138 million in one day — the second worst in 90 days.
- The Fear and Greed Index sits at 32, putting investors in “Fear Mode.”
- Analyst Ali Charts warns a weekly close below $1,850 could open the door to $1,560 and even $1,070.
Ethereum (ETH) is having a rough stretch. The token has dropped 12.6% over the past 30 days, making it the worst performer in the crypto top 5 by a wide margin.
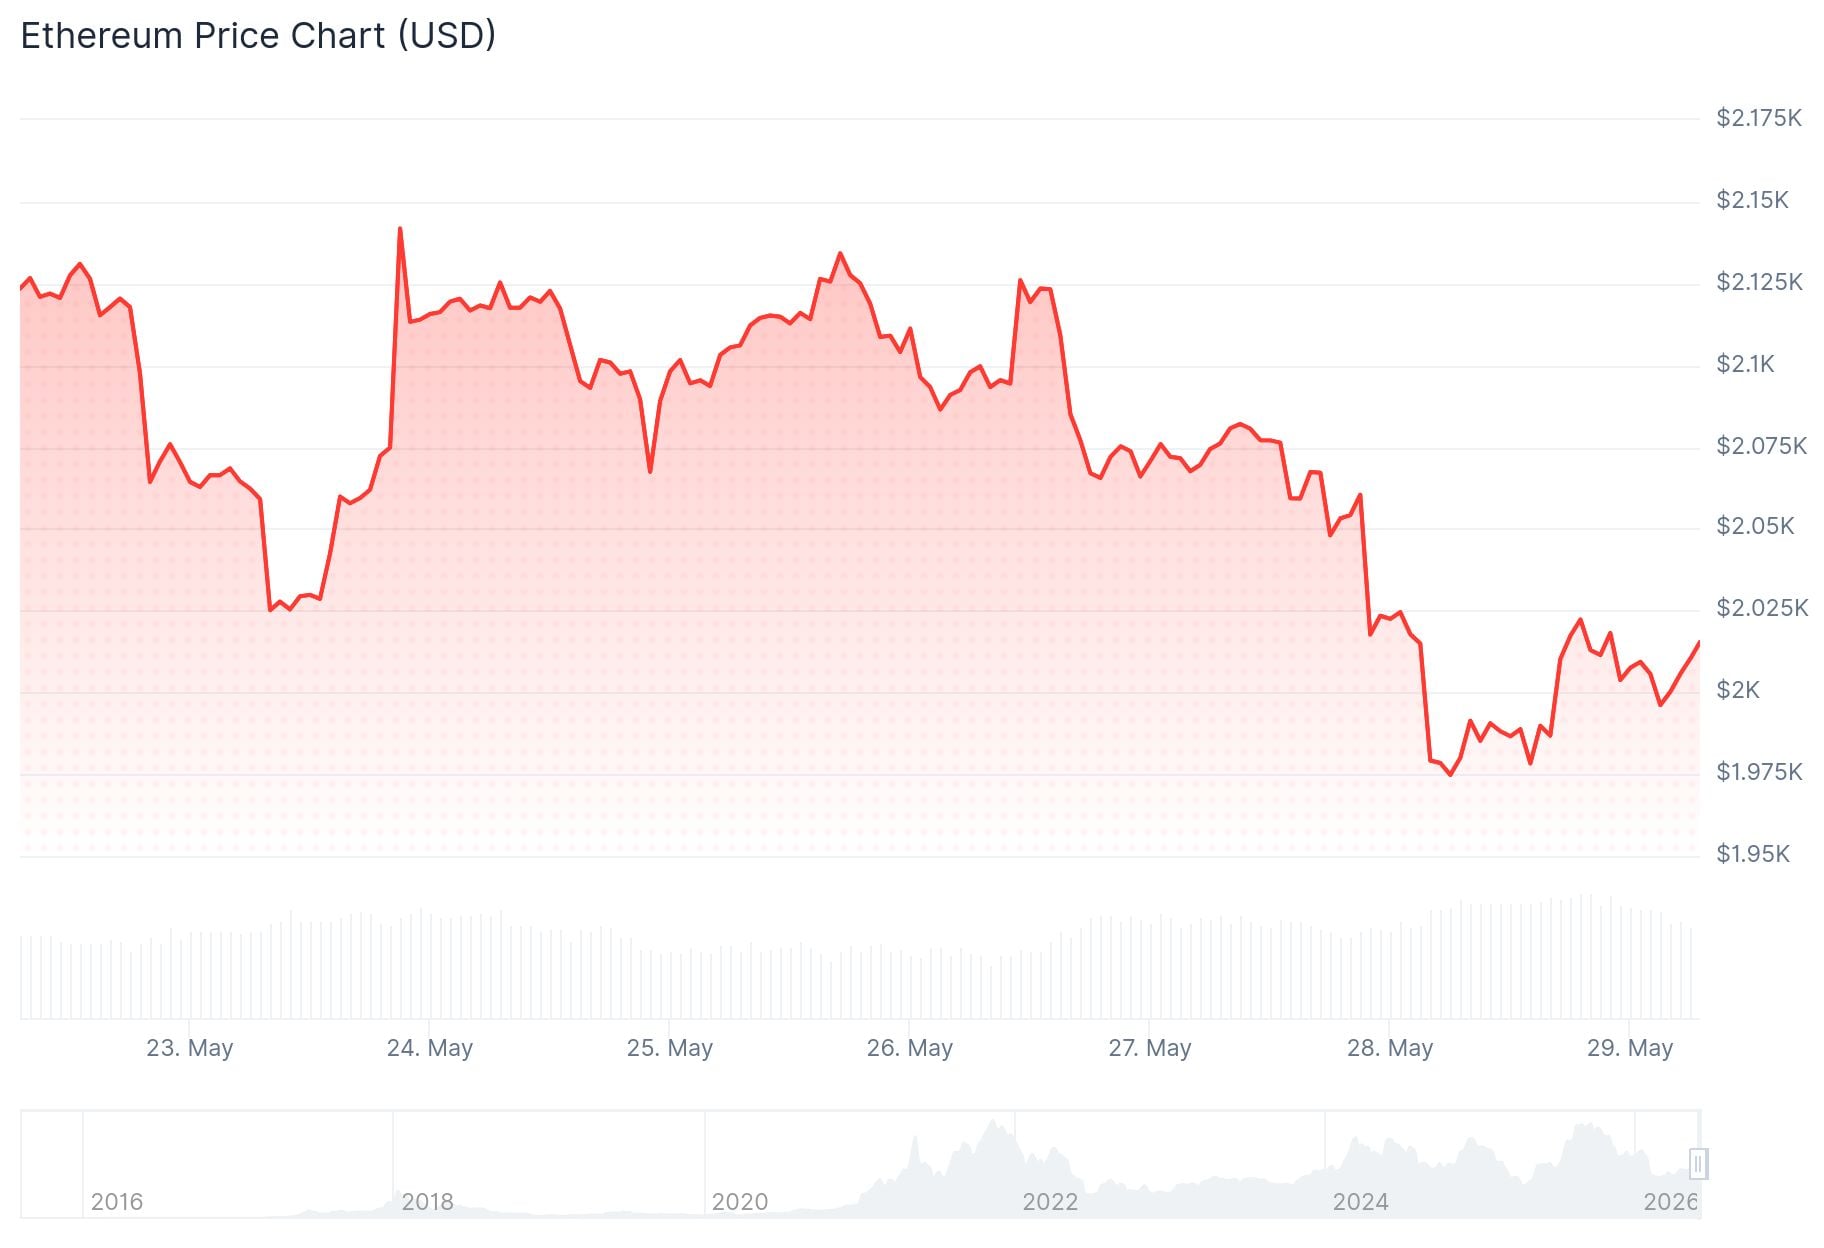
The pressure intensified this week when ETH slipped below the $2,000 mark — a price level that traders closely watch as a psychological threshold. During the session, it hit a low of $1,964 before pulling back slightly.
Trading volumes jumped 24% in 24 hours to $18 billion. That figure is close to 8% of ETH’s circulating market cap — a clear sign that selling pressure is rising fast.
Liquidations Hit Near 3-Month High
The drop has been made worse by a wave of forced selling. Long liquidations across the crypto market hit $861 million in a single session. Ethereum made up about a quarter of that total.

The day before, $138 million in ETH long positions were wiped out — the second highest single-day figure in the past 90 days. This kind of activity often signals a “long squeeze,” where falling prices trigger automatic sell orders, which push prices even lower.
Analyst Ali Charts flagged the situation on social media: “If Ethereum $ETH prints a weekly close below $1,850, a downside acceleration becomes highly likely.” He pointed to two key downside targets — $1,560 as an interim support level, and $1,070 as the lower boundary of the multi-year range. His technical read is based on the broader channel structure and the rejection seen at current levels.
If Ethereum $ETH prints a weekly close below $1,850, a downside acceleration becomes highly likely.
From a purely technical perspective, the broader channel structure points to two major downside targets following this rejection:
• First Target: Around $1,560 (interim… https://t.co/LNkygeXO5n pic.twitter.com/rOGsvEsahu
— Ali Charts (@alicharts) May 29, 2026

Market sentiment has soured alongside the price action. The Fear and Greed Index now sits at 32, a level not seen since early February, firmly in “Fear” territory.
What the Charts Are Saying
Resistance levels on the hourly chart are stacking up. A bearish trend line is forming with resistance near $2,010. Above that, the next hurdles are $2,020 and $2,050.
For bulls, the key level to hold is $1,965. A break below that opens the door to $1,950, then $1,920, and potentially $1,850.
On the macro side, fresh U.S. PCE inflation data came in at 3.3% — in line with expectations but high enough to rule out any rate cuts this year. That reduces the chance of a near-term boost from easier monetary policy.
One pattern analysts are tracking involves the weekly RSI. In 2019 and 2022, every time the RSI dropped to 30 or below, it marked the bottom of a bearish cycle. In both cases, price retested the cycle low before recovering. The RSI is currently near that same threshold, suggesting a retest of the $1,750 cycle low remains possible.
ETH is currently trading near $2,000, with a bearish trend line capping recovery attempts at $2,010.


