


TLDR
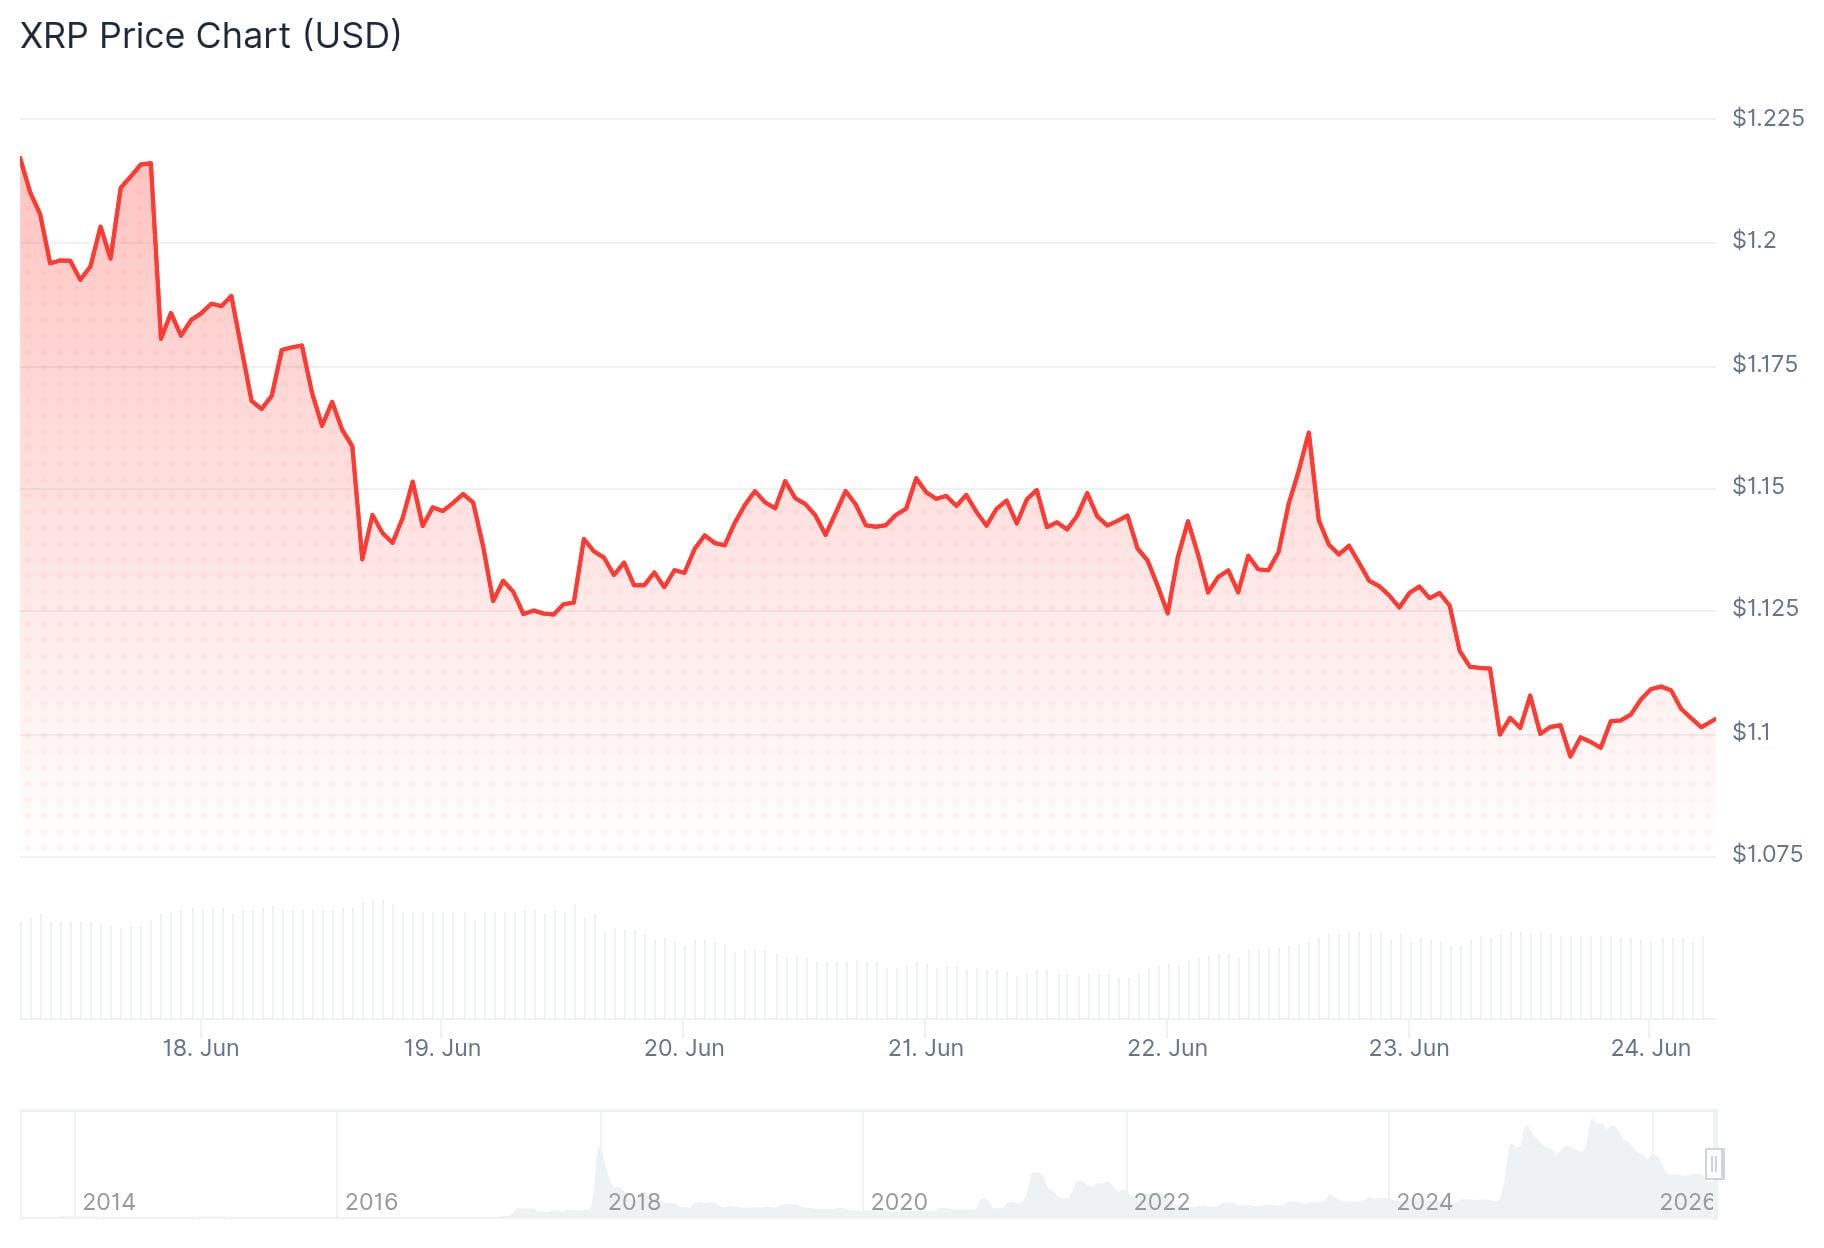
- XRP is trading around $1.09–$1.10, down roughly 10% on the week and 20% on the month
- A broad crypto market selloff, triggered by Bitcoin losing $65,000, dragged XRP lower
- Seven straight weeks of XRP spot ETF inflows have not been enough to reverse the downtrend
- Key technical indicators remain bearish, with XRP trading below its 50, 100, and 200-day moving averages
- Ripple received preliminary approval for a CASP license in Luxembourg under the EU’s MiCA framework
XRP is trading at around $1.09 on Tuesday, down roughly 5% in 24 hours. The token has now shed more than 10% over the past week and close to 20% over the past month.
The move lower follows a failed attempt to break above the $1.30 resistance level. Once that level held, sellers took control and pushed the price back toward the $1.00 zone that has supported XRP for several weeks.
Trading volume rose about 10% to roughly $1.48 billion, according to CoinMarketCap. The mid-June rebound has now faded, with sellers controlling 18 out of 26 daily candles so far this month.
The broader crypto market played a role too. Bitcoin falling below $65,000 triggered over $700 million in liquidations across the market, most of them long positions. As a high-beta asset, XRP felt that pressure more than most.
Macro conditions have added to the weight. Markets have shifted from expecting rate cuts this year to pricing in at least one hike following last week’s Federal Reserve meeting. That lifted the dollar and pulled capital out of risk assets including crypto.
Geopolitical noise also weighed on sentiment. Mixed signals from US-Iran peace talks in Switzerland added to uncertainty. The crypto Fear & Greed Index hit 23 on Monday, firmly in Extreme Fear territory.
ETF Inflows Stay Positive
Institutional demand has stayed steady despite the price drop. Spot XRP ETFs recorded about $5.31 million in inflows on June 22, led by Bitwise. That marks seven consecutive weeks of positive flows, with monthly totals above $29 million.

JUST IN: ETF clients buy $5.31 million worth of $XRP, bringing total ETF-held net assets to $993.29 million. pic.twitter.com/8ibP2ZxG7V
— Whale Insider (@WhaleInsider) June 23, 2026
Cumulative ETF inflows stand at $1.45 billion, with assets under management averaging $993 million according to SoSoValue. XRP exchange reserves have also fallen to multi-year lows as tokens move into ETF custody and long-term wallets.
Analyst ChartNerd flagged on X that historical XRP data shows consistent seasonal weakness in June and July during US midterm years, pointing to 2018, 2022, and 2026 as matching setups. ChartNerd noted the pattern typically involves choppy consolidation followed by sharp drops, with eyes on a post-summer recovery.
Historical $XRP data shows consistent seasonal weakness in June/July during U.S. midterm years (2018, 2022, 2026). The pattern: choppy consolidation followed by sharp drops within this window. 2026 has mirrored this exact setup. My eyes are set on a post summer recovery/rebound. https://t.co/TSBmA0gtiG pic.twitter.com/RwDGl2XBjB
— 🇬🇧 ChartNerd 📊 (@ChartNerdTA) June 23, 2026
Technical Picture
XRP is trading well below its 50-day, 100-day, and 200-day EMAs at $1.25, $1.35, and $1.56. The RSI sits at 37–40, signaling weak bearish momentum. The MACD histogram near zero hints at stabilization but not a recovery.
The lower Bollinger Band at $1.07 is the first support level. A break there opens the door to $1.05 and then the $1.00 psychological level.
On the upside, resistance sits at $1.15, then $1.22, then $1.25. Futures open interest stands at $2.69 billion, up slightly from $2.55 billion the day before.
Ripple received preliminary approval for a Crypto Asset Service Provider license from Luxembourg’s financial regulator under the EU’s MiCA framework on Tuesday. The approval is not yet final and remains subject to additional conditions.


