


TLDR
-
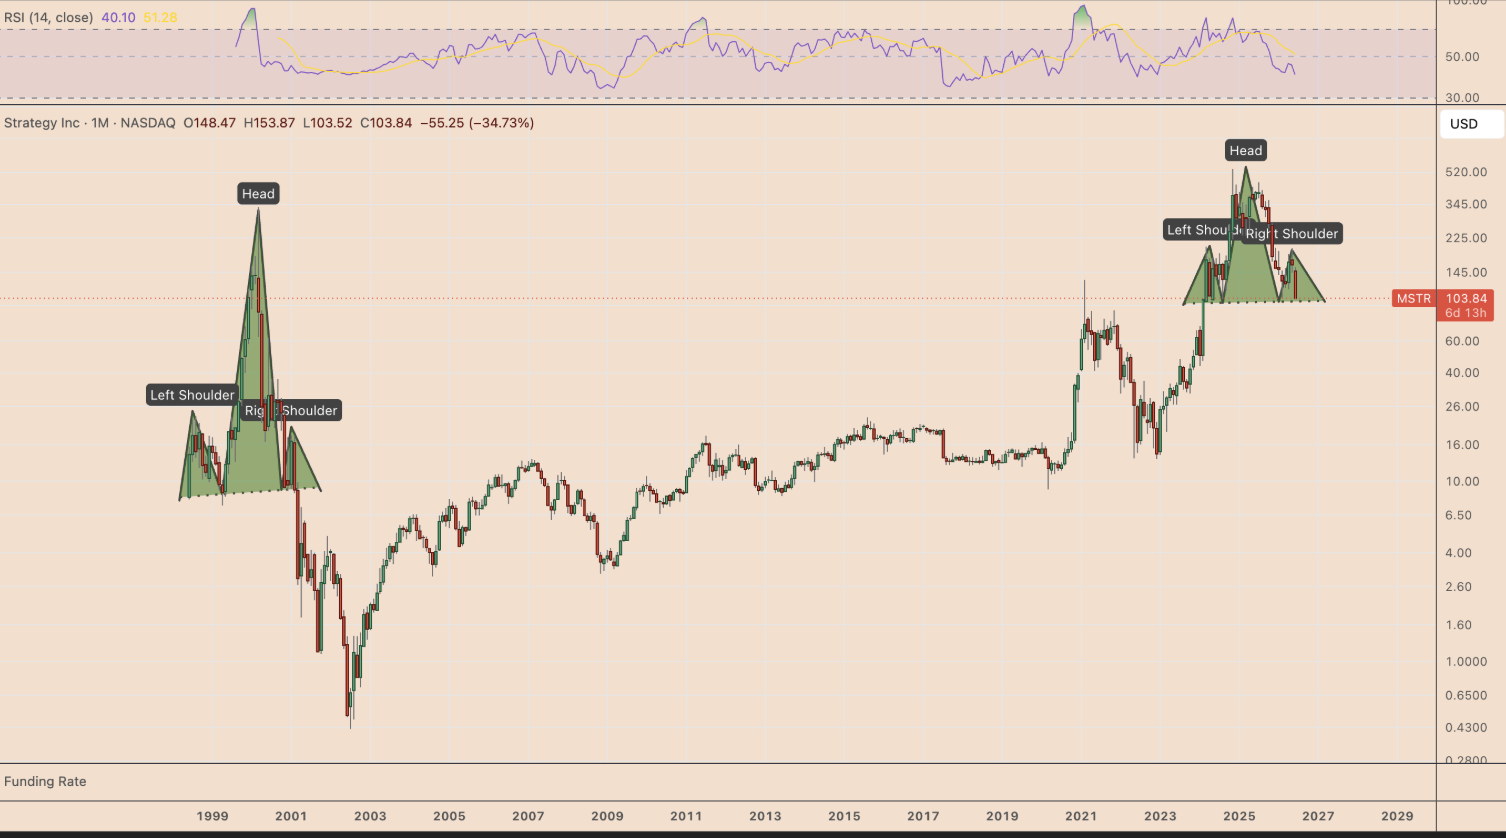
MSTR stock is forming a head-and-shoulders pattern similar to its dot-com-era setup.
-
The neckline support sits near the $100–$105 range on the monthly chart.
-
A confirmed breakdown could open an 80% downside target near $20.
-
Strategy’s cash reserve has reportedly fallen 38% since the start of 2026.
-
CryptoQuant analyst Julio Moreno said dividend coverage has dropped to about 14 months.
Strategy faces renewed pressure as its monthly chart shows a bearish pattern last seen before its dot-com crash. The setup points to a possible 80% fall if MSTR repeats that earlier structure. The pressure also comes as cash reserves shrink and preferred-stock costs rise.
MSTR Stock Tests Bearish Dot-Com-Era Pattern
MSTR stock has formed a potential head-and-shoulders pattern on its monthly chart since March 2024. The structure includes three peaks, with the middle peak standing above the two side peaks.
The neckline sits near the $100 to $105 support area, based on the chart setup. A clear break below that range would confirm the bearish pattern.
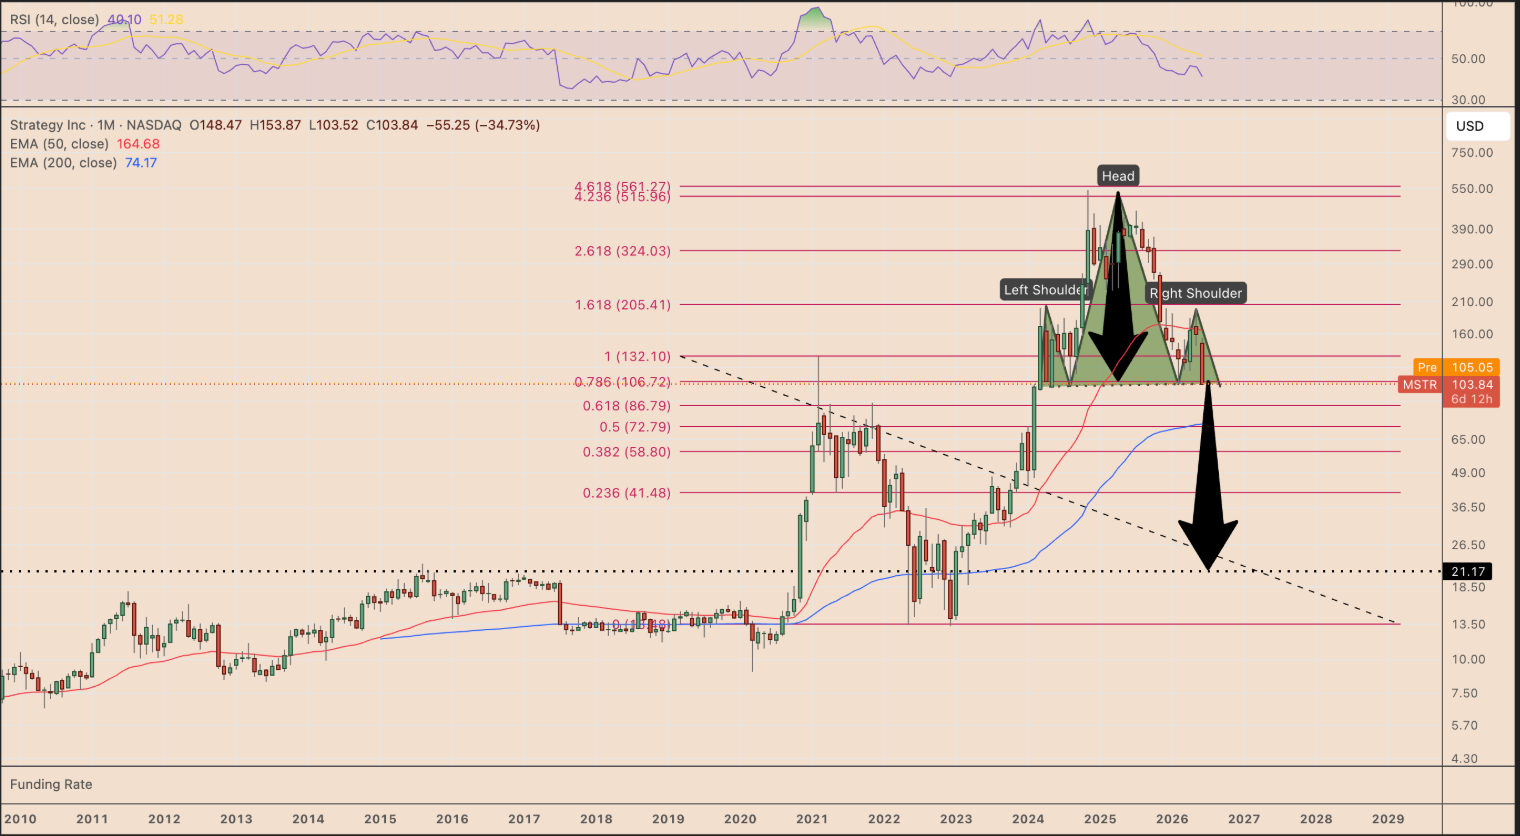
Technical traders usually measure the target from the head to the neckline. Under that method, MSTR could fall toward $20 if the structure completes.
That target would mark a drop of about 80% from current levels. The same chart pattern appeared before Strategy’s dot-com-era collapse.

During that period, MSTR broke below a similar neckline and then lost over 99% in two years. The current setup has drawn attention because the chart structure shows a close resemblance.
The stock now trades near a critical area as traders track the neckline. A sustained break could shift focus toward a longer correction.
Strategy Faces Cash Pressure And Dilution Risk
Strategy also faces pressure from its preferred-stock dividend costs. CryptoQuant analyst Julio Moreno said its yearly dividend obligations rose to about $1.2 billion.
Moreno said the company’s dollar cash reserve has dropped 38% since the start of 2026. He also said dividend coverage fell from more than seven years to about 14 months.
“At current dividend obligations of $1.2 billion per year, restoring 24 months of coverage would require a cash reserve of approximately $2.8 billion,” Moreno said.
He added that this figure equals roughly twice Strategy’s current cash reserve. “A higher cash reserve is the most direct signal the market needs to regain confidence in STRC,” he said.
STRC recently fell to a record low of $82.50. It has since traded mostly between $82 and $89, below its $100 par value.
The lower price pushed STRC’s effective yield above 13%. That compares with its stated dividend rate of about 11.5%.
Strategy holds 847,363 BTC at an average cost of $75,650 per coin. Bitcoin recently traded near $62,600, below the company’s average purchase price.
The company sold 2.71 million MSTR common shares for about $335.5 million in June. It used $34.9 million from those proceeds to buy 520 BTC.
🚨 Our JUNE Stock Picks Are Live!
A new month means new opportunities. Our analysts have just released their top stock picks for June, highlighting companies with strong momentum that rank highly on our KO Score algorithm. We’re also now sharing trade ideas for both long-term and short-term investors, giving you more ways to spot potential opportunities in the market.
Sign up to Knockout Stocks today and get 50% off to unlock the full list and see which stocks made the cut.
Use coupon code Special50 for your exclusive discount!
Get 3 Free Stock Ebooks
Discover top-performing stocks in AI, Crypto, and Technology with expert analysis.
- Top 10 AI Stocks - Leading AI companies
- Top 10 Crypto Stocks - Blockchain leaders
- Top 10 Tech Stocks - Tech giants


