






TLDR
- ADA is trading near $0.16, holding above a key weekly demand zone between $0.14–$0.17
- The weekly RSI has dropped to one of its most oversold readings on record
- A potential inverse head-and-shoulders pattern is forming but has not yet been confirmed
- First major resistance sits at $0.224–$0.236; a break above could target $0.31
- Analyst fair value estimate sits at $0.56, with long-term targets up to $4.55
Cardano (ADA) is trading near $0.16, down roughly 1.88% over the past 24 hours. The token has a market cap of around $6.07 billion and daily trading volume of approximately $188 million.
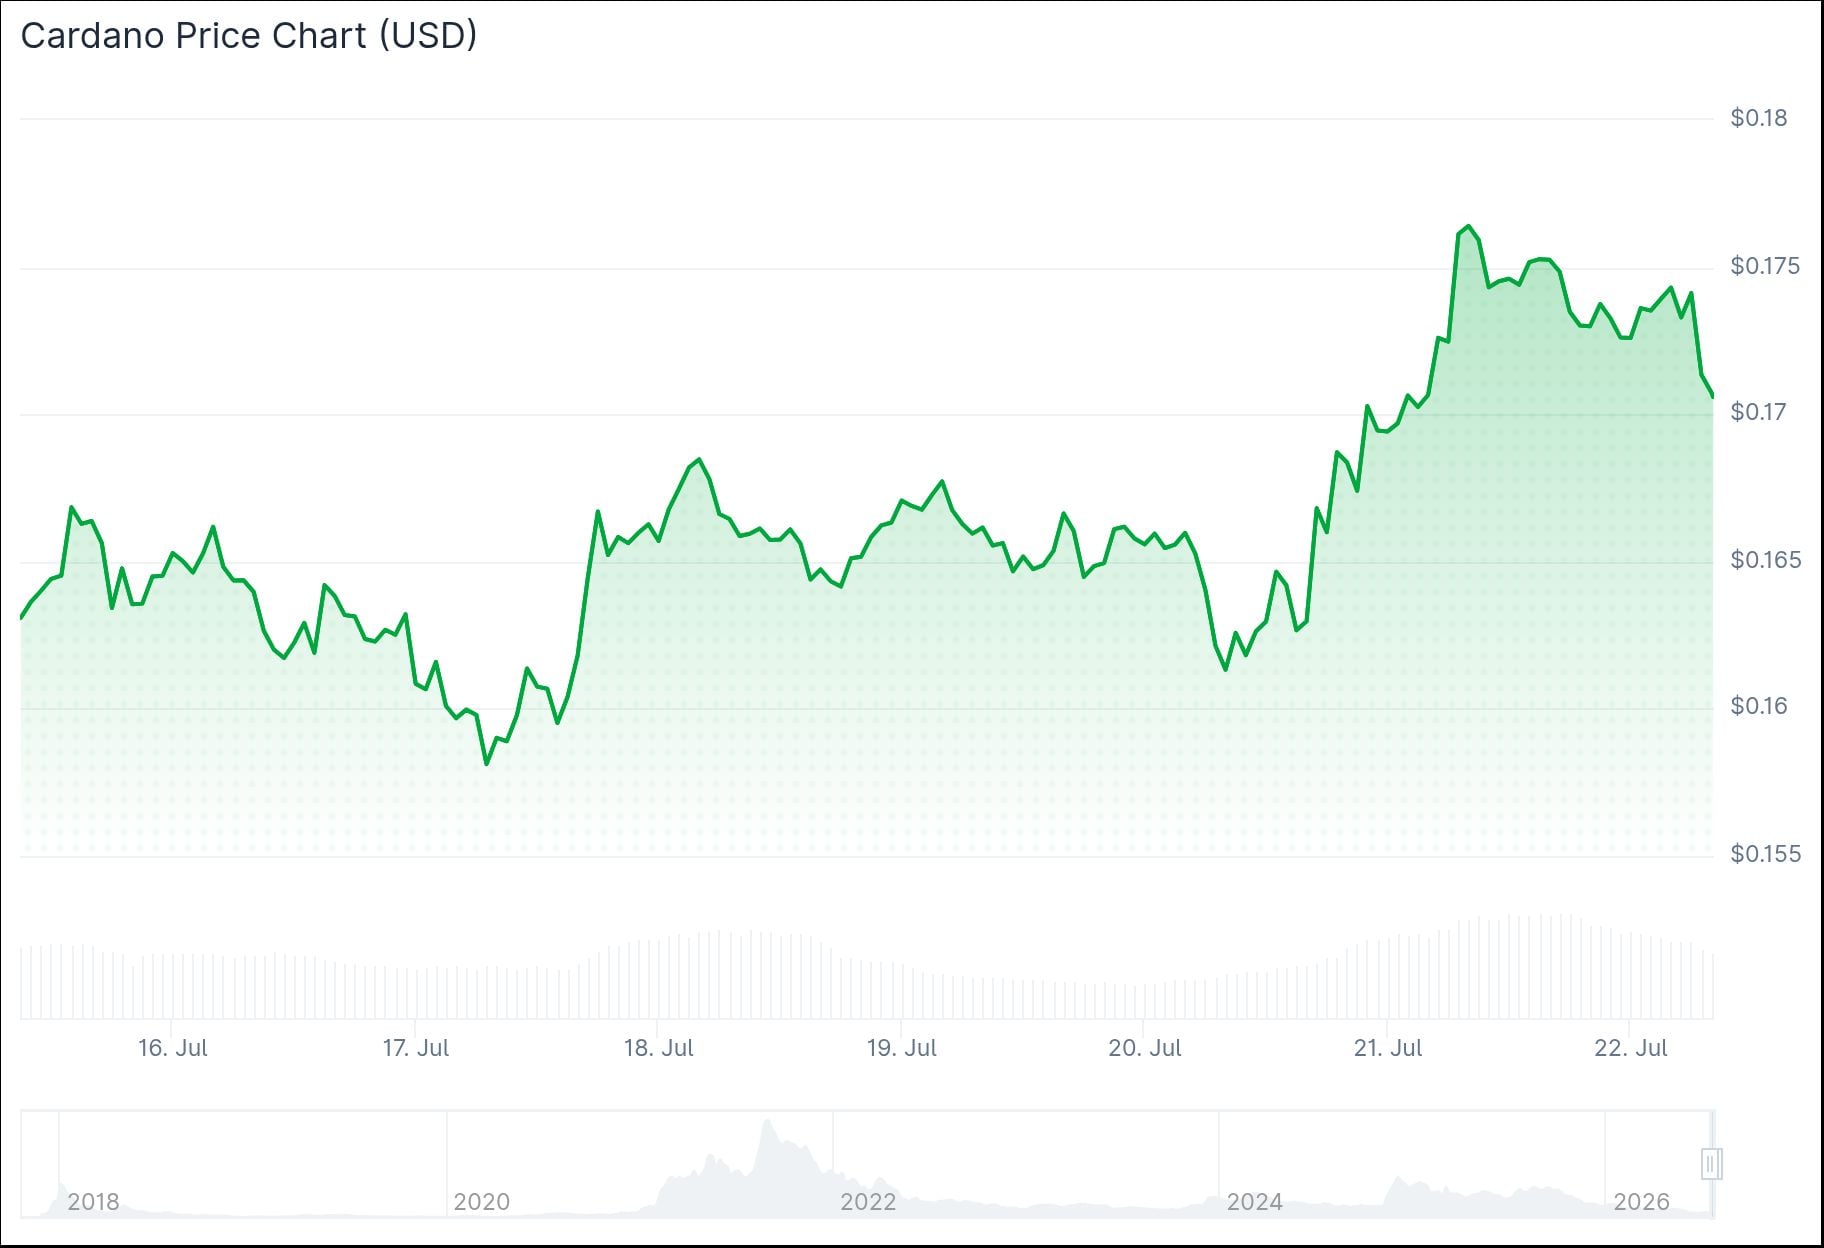
ADA is sitting just above a weekly demand zone that analysts have been watching closely. That zone runs between $0.14 and $0.17, and it has repeatedly absorbed downward price pressure.
The selling pressure is still present, but each push lower is showing less follow-through. Analysts see this as a possible sign that sellers are losing momentum.
Crypto analyst Master of Crypto noted on X that ADA has been making higher lows inside a rising channel. He said the price is now above $0.175 after bouncing from support and that the next target sits around $0.219 — about 25% upside from current levels.
$ADA has made higher lows inside a rising channel.
Price is now above $0.175 after bouncing from support.
If this trend continues, the next target is around $0.219.
That is about 25% upside from the current price. pic.twitter.com/vAcK1Kpcuz
— Master of Crypto (@MasterCryptoHq) July 21, 2026
RSI Reaches Extreme Oversold Territory
The weekly Relative Strength Index for Cardano has fallen to one of its most oversold readings on record. Analyst Quantum Ascend flagged this on X, pointing to $0.14 as the key support level and $0.236 as the main resistance for any recovery.
$ADA | @Cardano_CF 📽️
Weekly RSI Most Oversold in History 👀
Major Resistance: $0.236
Current Support: $0.14 ✅
Next Buy Level: $0.10Here's the High Timeframe for Cardano👇 pic.twitter.com/9Y4fgnLwrn
— Quantum Ascend (@quantum_ascend) July 18, 2026

Oversold RSI readings do not guarantee a reversal, but they often appear when downside momentum is stretched. The risk-to-reward balance can begin to improve for buyers at these levels.
If ADA holds above $0.14, the bottoming structure stays intact. A break below that level could expose the token to the next support area near $0.10.
Inverse Head-and-Shoulders Pattern in Play
Analyst CryptoJack has identified a possible inverse head-and-shoulders pattern forming on the lower timeframes. The left shoulder, head, and right shoulder are developing near the $0.16–$0.17 range.
$ADA has formed an inverse Head and Shoulders pattern.
You know what comes next… pic.twitter.com/RiLp23rFra
— CryptoJack (@cryptojack) July 18, 2026
The pattern is not confirmed yet. ADA still needs to break above the neckline formed by recent swing highs.
A confirmed breakout would point toward the $0.18–$0.19 range first, then toward the $0.224–$0.236 resistance band. Analyst The Boss placed further upside targets at $0.3136, $0.3825, and $0.4488 on the weekly chart.
A separate analyst set ADA’s estimated fair value at $0.56, based on their technical indicator set. They also identified a support zone between $0.11 and $0.17, which has been tested multiple times since 2022.
The next resistance on the daily chart sits near $0.23. If buying momentum improves from there, ADA could push toward $0.32, according to that analysis.
Weekly indicators do not yet show a strong increase in buying demand, which keeps sustained upward movement uncertain for now.


