






TLDR
- Ethereum traded at $2,436 on August 29, down 2.33% on the day
- U.S. spot Ethereum ETFs posted 10 straight days of net inflows totaling $1.52 billion
- BlackRock’s ETHA led with $1.02 billion in inflows over nine days, taking ~72% of category flows
- The CLARITY Act faces a Senate cloture vote on September 15
- ETH key support sits at $2,350, with resistance at $2,500
Ethereum fell to $2,436 on August 29 as broader crypto markets dropped 1.71% over 24 hours, pulling the total crypto market cap to $2.62 trillion. Bitcoin was trading below $78,000 and XRP sat around $1.38.
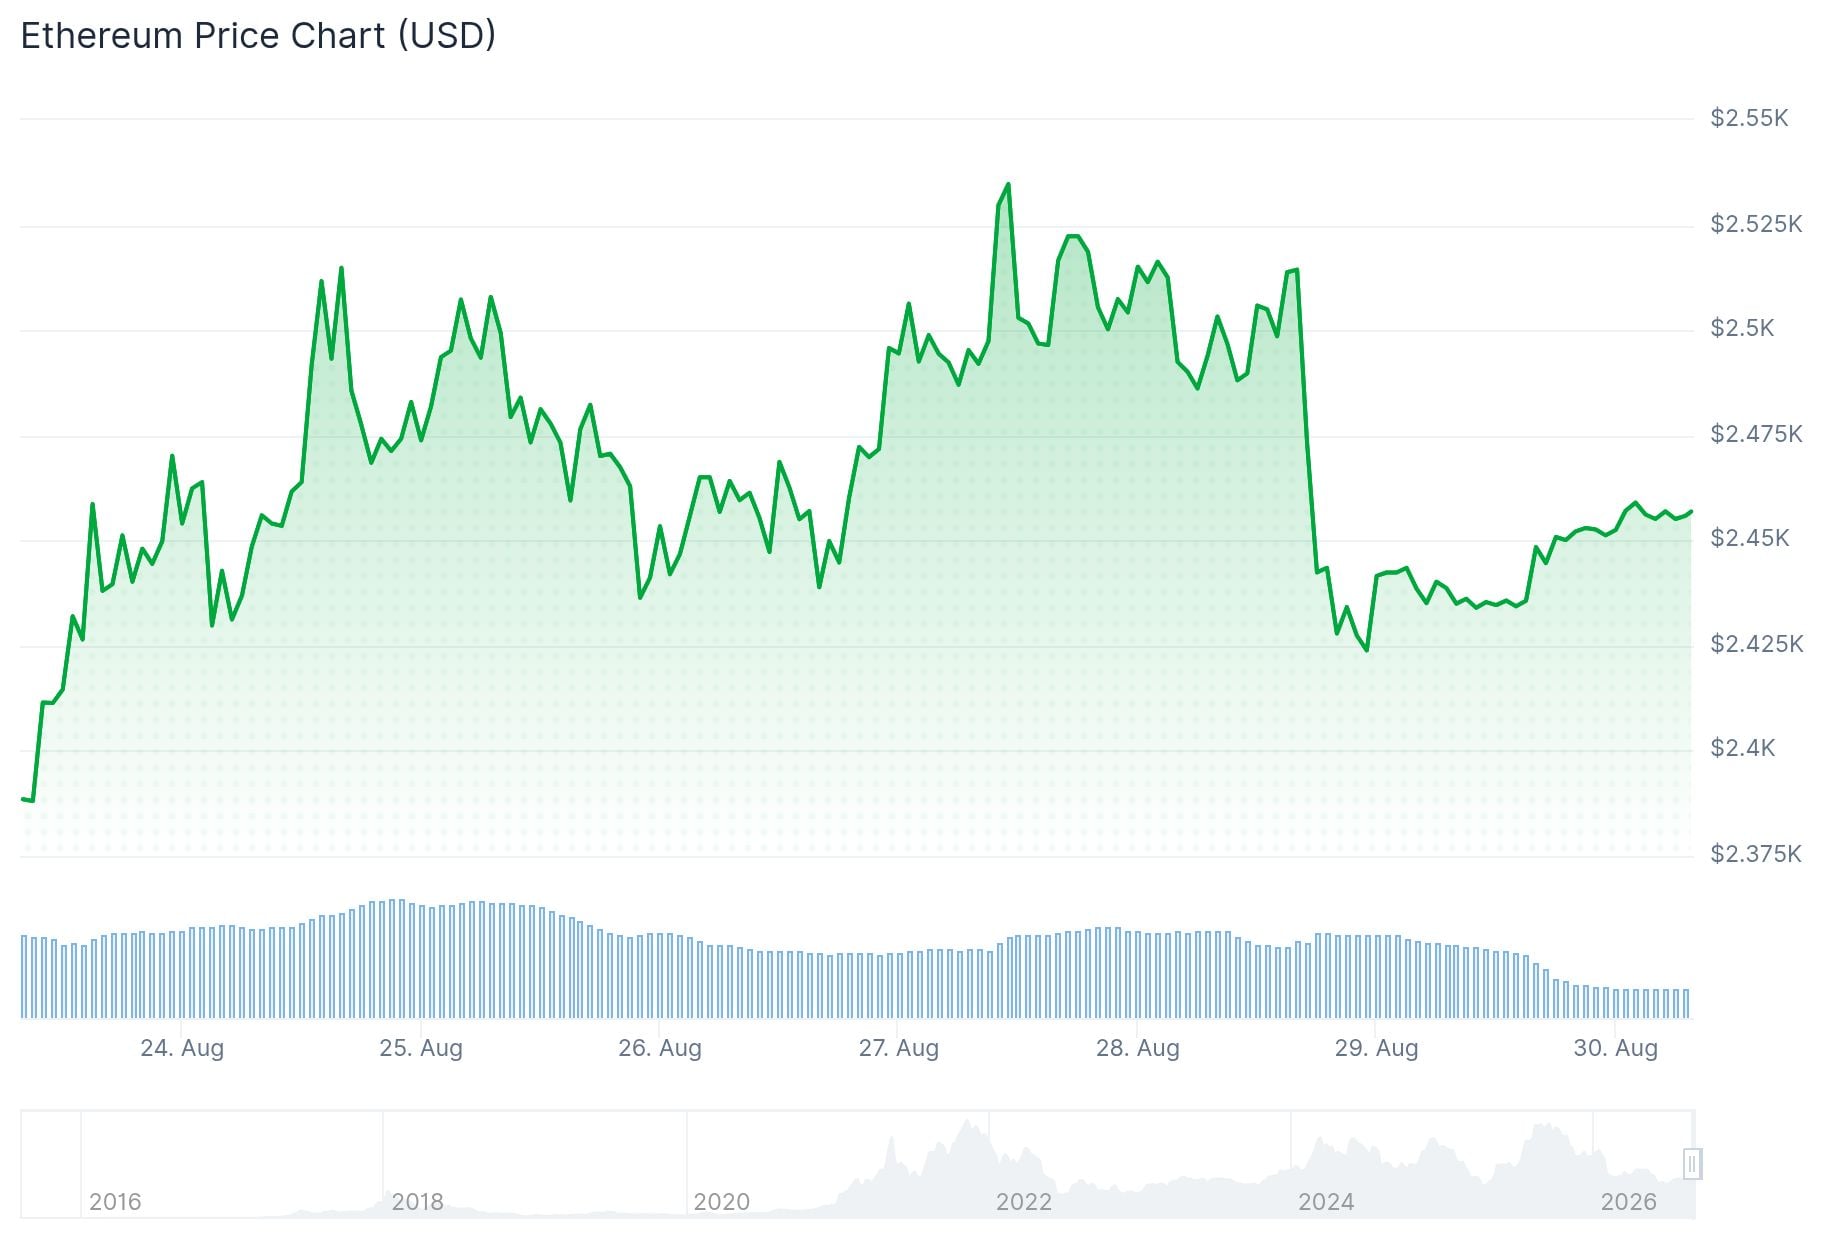
Despite the price dip, ETH has rallied sharply from around $1,900 in mid-August. The coin pushed past $2,200 and tested $2,500 multiple times before pulling back.
U.S. spot Ethereum ETFs recorded $102.18 million in net inflows on August 28, marking the 10th consecutive day of positive flows. Total inflows across the streak reached approximately $1.52 billion.
The week ending around August 21 delivered roughly $697 million in Ethereum ETF inflows — the strongest weekly total in about 10 months and a 2026 high at the time, per SoSoValue.
BlackRock Dominates ETF Flows
BlackRock’s ETHA pulled in approximately $1.02 billion across nine straight sessions from August 17 to August 27, accounting for around 72% of all U.S. spot Ethereum ETF inflows during that period.
BLACKROCK BUY STREAK: $1 BILLION $ETH
BlackRock’s clients have purchased over $1 Billion of ETH without any days in which they net-sold. In the past 9 days, BlackRock’s ETHA ETF purchased $1.02B of ETH.
BlackRock’s ETHA estimated average buy price is $3,060 ETH. pic.twitter.com/JAy824MUag
— Arkham (@arkham) August 28, 2026
August 27 was the strongest single day, with $225.8 million in inflows — the highest daily figure since October 28, 2025. ETHA’s cumulative net inflows since its July 2024 launch now stand near $12.74 billion, with net assets around $8.46 billion.

The ~385,633 ETH accumulated over eight days implies an average purchase cost between $2,490 and $2,550. That sits well below ETHA’s lifetime average cost basis of approximately $3,060.
Spot ETF flows are client-driven, not proprietary BlackRock purchases. When investors buy ETHA shares, the fund acquires Ethereum through Coinbase Prime to back them.
Fidelity’s FETH was the only fund to record outflows on August 28, losing $24.26 million. Grayscale, Bitwise, VanEck, and Franklin products reported no daily flow changes.
ETH Price Levels to Watch
ETH’s RSI stood at 44.09, showing reduced momentum but not oversold territory. The MACD line sat at 0.65, below the signal line at 12.62, with the histogram dropping to -11.97.
ETH/BTC is sitting at a key breakout level.
Price is forming a triangle with lower highs and higher lows. The range keeps getting tighter, which means a big move is getting closer.
A breakout above the trendline could send $ETH toward $2,800.
A rejection could push it back… pic.twitter.com/KSz9iiGZov
— Ash Crypto (@AshCrypto) August 29, 2026
Analyst Ash Crypto noted on X that ETH/BTC is forming a triangle pattern with tightening range. He said a breakout above the trendline could push ETH toward $2,800, while a rejection could pull it back to $2,000–$2,200.
If this is a true breakout on $ETH, we're expecting to see a lot more upside, probablyanother leg.
My expectations are that the next leg goes to $3,200, perhaps even $3,500 and stalls from there.
Don't sell your positions too early. pic.twitter.com/YXxmvktELn
— Michaël van de Poppe (@CryptoMichNL) August 29, 2026
Analyst Michaël van de Poppe (@CryptoMichNL) posted that if ETH confirms a true breakout, he expects the next leg to reach $3,200, possibly $3,500.
The CLARITY Act, which passed the House, now faces a Senate cloture vote on September 15 that will require 60 votes to advance.


