





TLDR
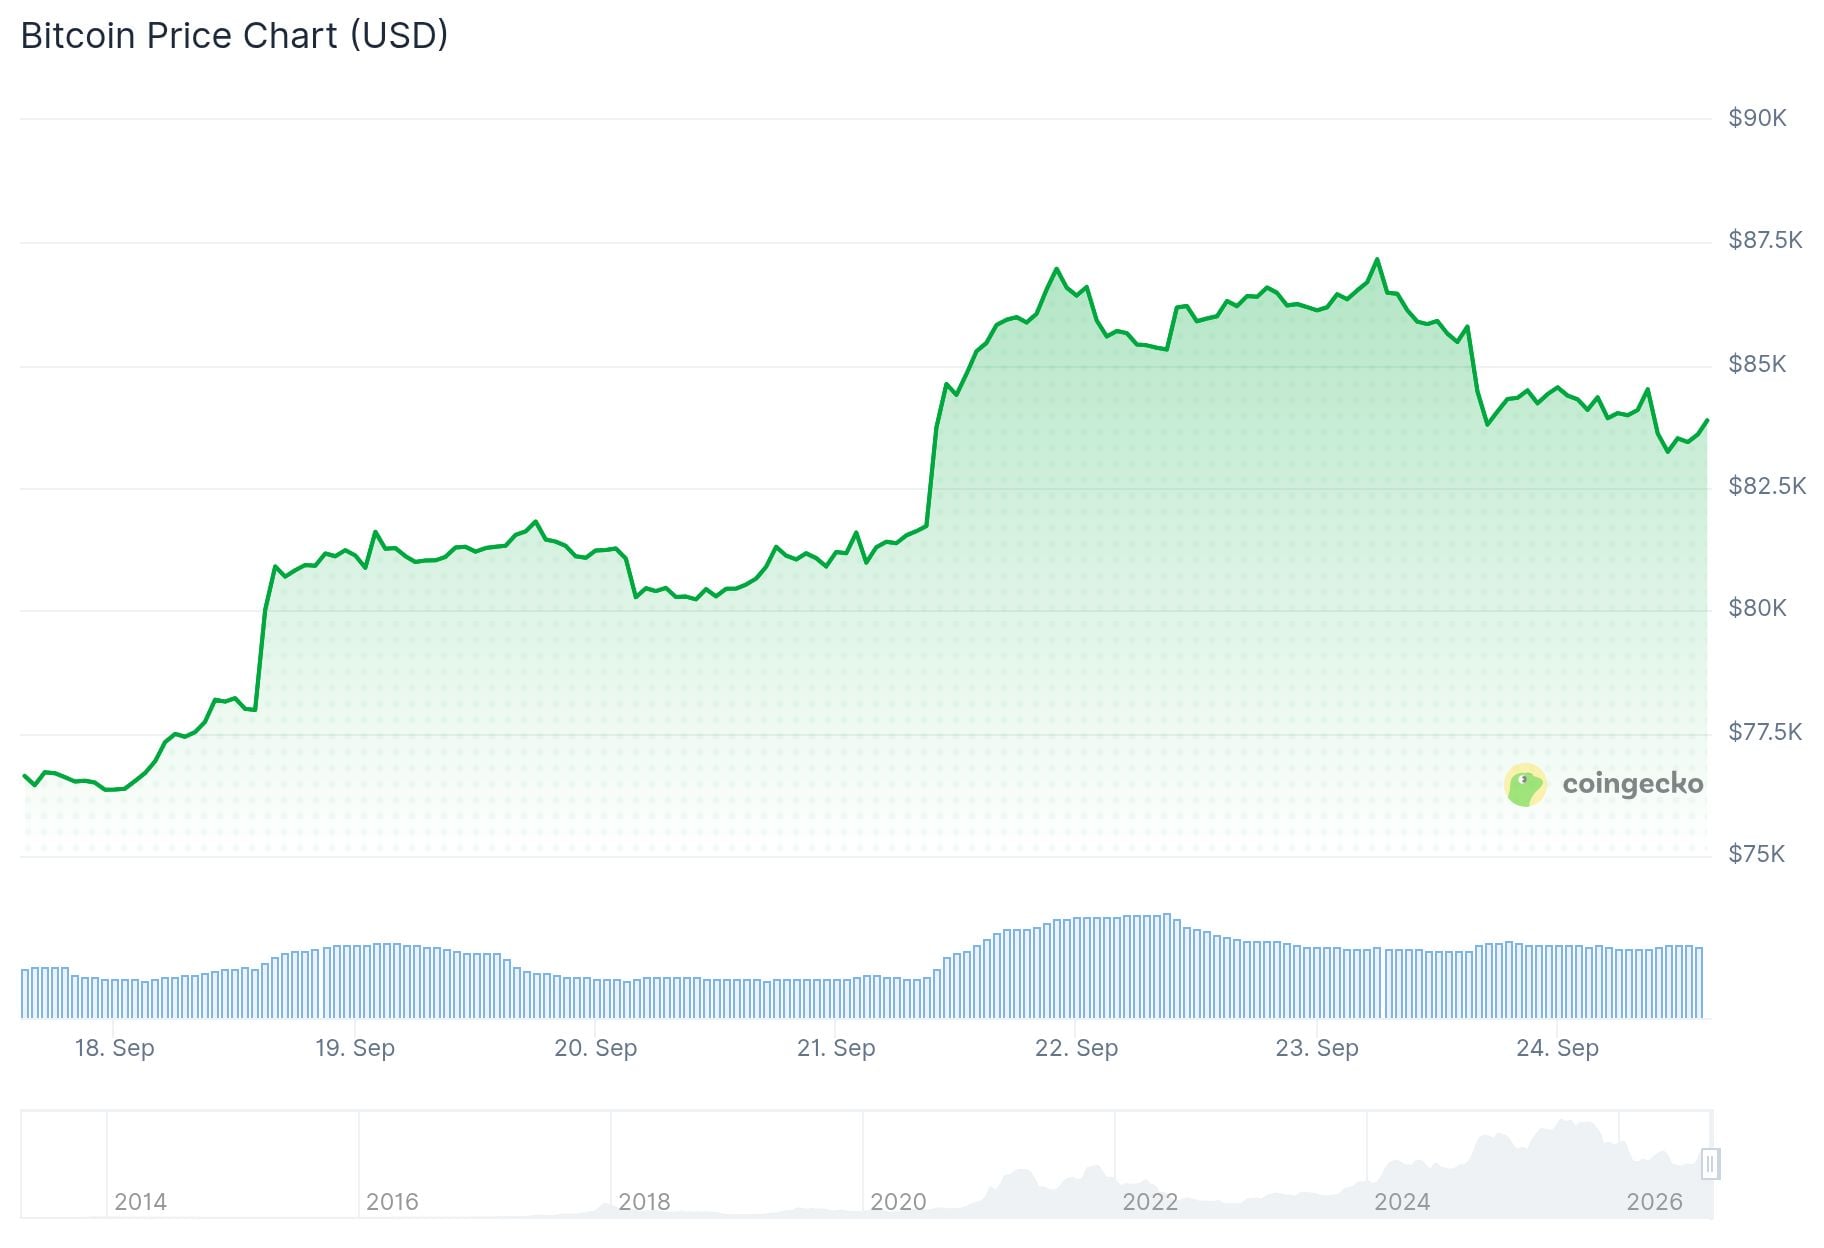
- Bitcoin dropped below $84,000, trading near $83,200 during Asian hours on Thursday.
- The US 10-year Treasury yield hit 5.13% intraday, its highest level since 2007.
- CME’s FedWatch tool shows a 75.3% chance of an October rate hike.
- Bitcoin is still up 7.35% for September despite the pullback.
- An analyst pointed to $81K-$82K as the next support zone after a rejection near $87K.
Bitcoin fell below $84,000 on Thursday, slipping to $83,200 during Asian trading hours. The drop came as the US 10-year Treasury yield reached its highest level since 2007.
The 10-year yield closed Wednesday at 5.11%, up from 4.96% the day before. It touched 5.13% during the day. Stronger US business data and rising oil prices drove the move.
Bitcoin lost 2.4% to trade at $83,687.7 by 09:16 ET. Other cryptocurrencies fell too. Ethereum, Cardano, XRP, and Dogecoin all posted losses on the day.
BREAKING: The US 30Y Note Yield rises to 5.44%, its highest level since June 2004.
We are nearing a +500 basis point gain from the 2020 low.
Where is the US Treasury? pic.twitter.com/nnoApVuyHS
— The Kobeissi Letter (@KobeissiLetter) September 24, 2026
Rising Treasury yields give investors better returns on government debt. This can pull money away from riskier assets like Bitcoin.
Rate Hike Odds Climb Fast
Bas Kooijman, CEO of DHF Capital, said stronger US business activity and higher energy prices raised expectations of more Fed tightening. He noted markets now price in a 70% chance of an October hike, up from 55% the day before.
CME Group’s FedWatch tool puts the odds even higher, at 75.3%, for a hike to 4.00-4.25%. The Fed meets on October 28.

Kooijman said labor data will matter in the coming weeks. Strong numbers could push yields and the dollar higher. Weaker data could cause traders to pull back their hike bets.
The US Treasury added pressure Wednesday. It announced a $6 billion buyback of bonds with 20 to 30 years left on them. The move is part of a plan to improve liquidity in long-dated debt.
Oil prices also rose overnight. Iranian President Masoud Pezeshkian gave a speech at the United Nations that criticized the US and President Trump. This added to concerns that oil supply talks between the US and Iran may not move forward as expected.
Japanese 10-year bond yields hit a 30-year high on Thursday. Bond yields rose across developed markets on bets of more rate hikes ahead.
Chart Levels Traders Are Watching
James Stanley, senior market analyst for global macro at FOREX.com, wrote that Bitcoin has held up despite rising rates and a strong dollar. He named $82,833 as the next level to watch if the price keeps falling.
Analyst BATMAN, known on X as @CryptosBatman, shared a chart breakdown of Bitcoin’s recent move. He said the rejection near $87,000 lined up with the 1.618 Fibonacci extension target, a level traders often use to predict where a price rally might run out of steam. He said traders are taking profits around that zone. He pointed to $81,000-$82,000 as the closest support area if the pullback continues.
Here's what $BTC looks like up close.
The rejection we saw at $87K is exactly the 1.618 Fibonacci extension target.
Traders are taking profits around that area.
The closest support level is the previous resistance, $81K-$82K. https://t.co/id4xYIQ5gU pic.twitter.com/NdRY98qTTE
— BATMAN ⚡ (@CryptosBatman) September 24, 2026
Bitcoin traders often call September “Red September” and October “Uptober” due to their historic patterns. Bitcoin fell in five straight Septembers from 2017 through 2021. But it has closed September in the green every year since 2022.
Bitcoin is up 7.35% this month so far. October has averaged a 19.92% gain historically, the second-best month of the year. Last year, though, October broke that pattern and Bitcoin fell 3.69%.


