






TLDR
- Ethereum trades near $2,680, up 0.40% in 24 hours
- Whales with 10K-100K ETH bought 260K ETH since Saturday after last week’s selling
- US spot ETH ETFs logged a fourth straight day of net inflows worth $104.6 million
- BlackRock’s ETHA led inflows with $50.8 million on September 23
- ETH is testing the $2,560-$2,600 zone, a level that flipped from resistance to support
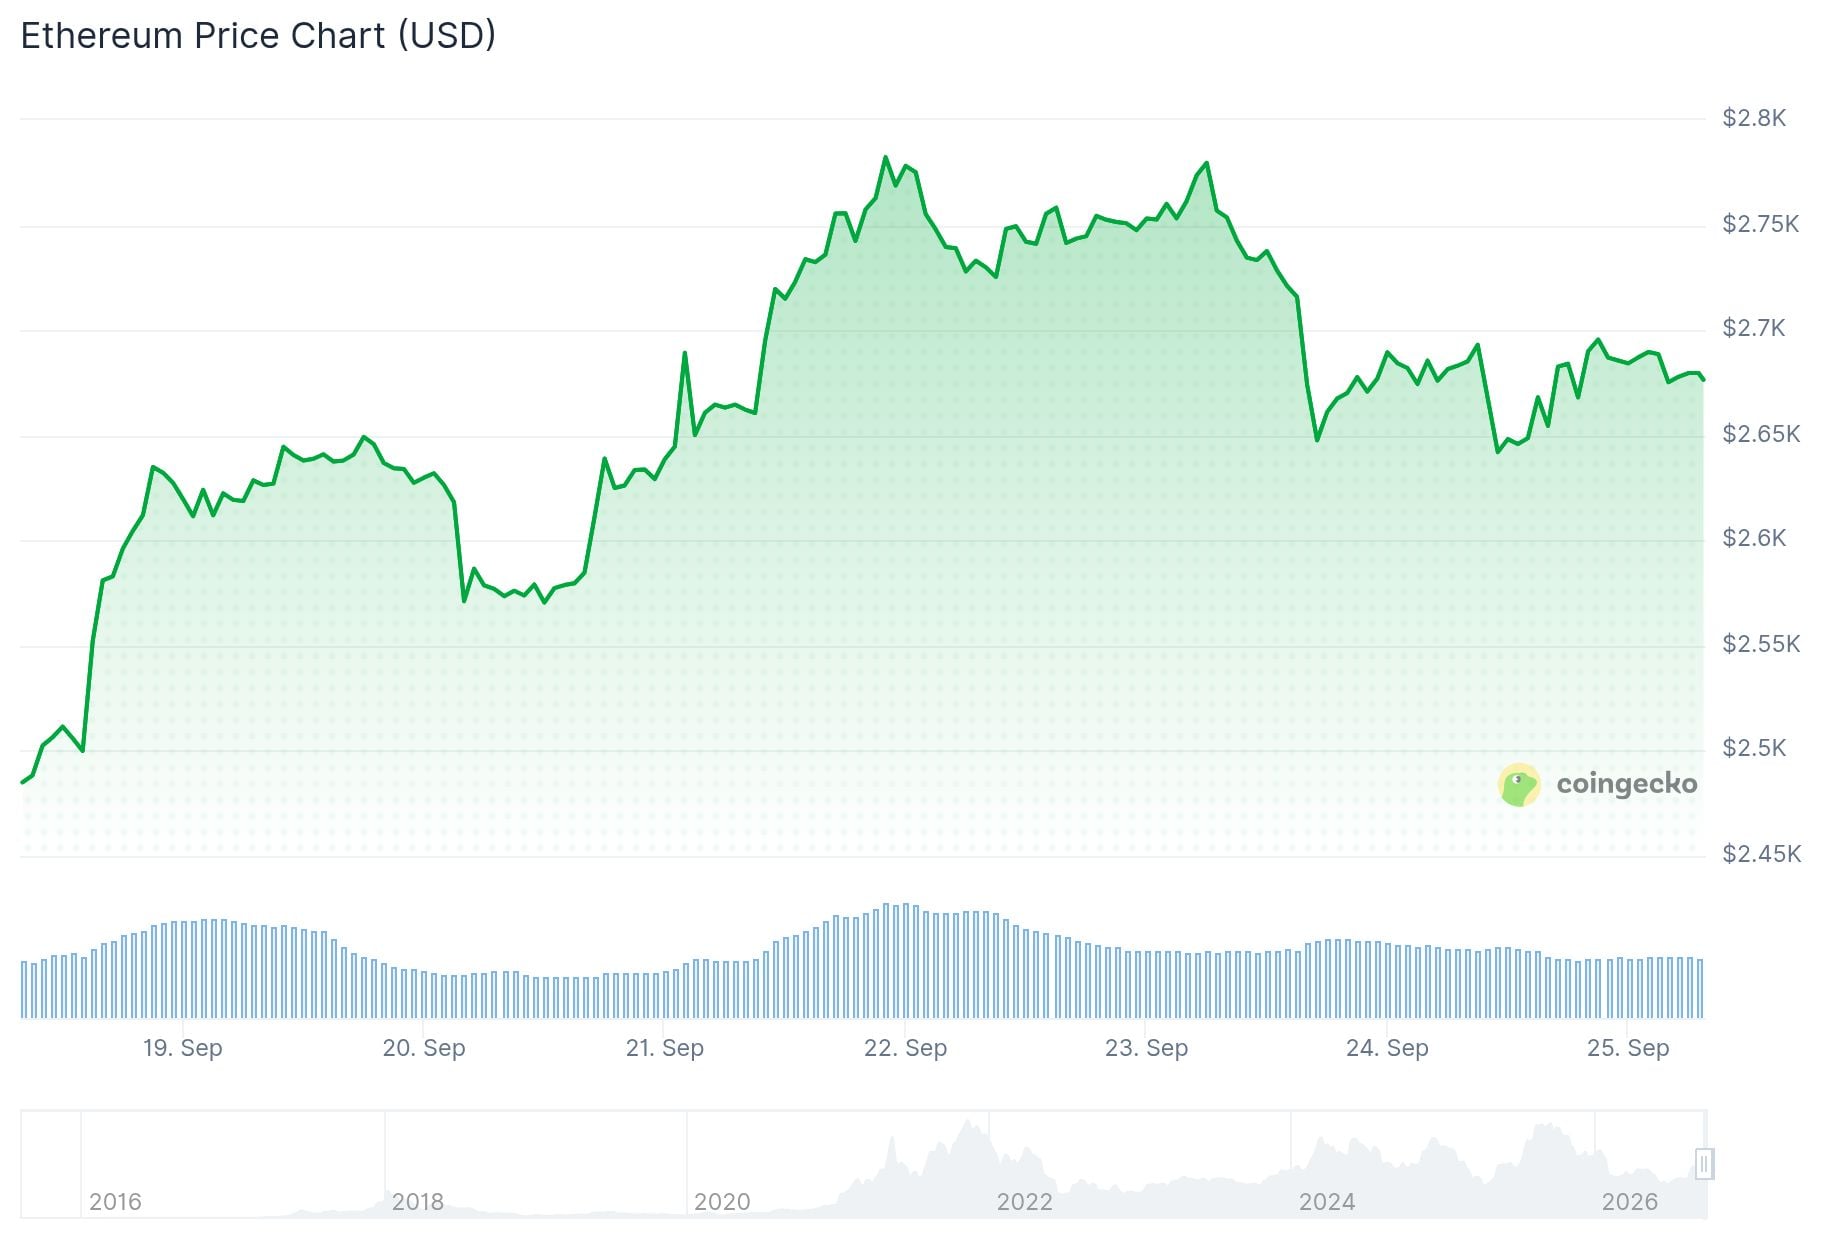
Ethereum is trading at $2,680 today. That’s up 0.40% over the past 24 hours. The token has a market cap of roughly $328 billion.
Large ETH holders are buying again. Wallets holding between 10,000 and 100,000 ETH picked up 260,000 ETH since Saturday, according to CryptoQuant data.
This follows a rough stretch last week. That same group of whales sold 140,000 ETH over three days after the Clarity Act stalled in the Senate.
Smaller holders showed different behavior. Wallets with 1,000 to 10,000 ETH stayed mostly flat before a small 50,000 ETH sell-off in the past two days.
Investors holding between 100 and 1,000 ETH kept selling. This group has offloaded about 140,000 ETH since the Clarity Act news broke.
Exchange data shows withdrawals outpacing deposits recently. This suggests some investors are buying the dip while others take profits.
ETF Demand Stays Strong
US spot Ethereum ETFs saw a fourth straight day of net inflows. Wednesday’s total came to $104.6 million.

Sept 24 Update:#Bitcoin ETFs:
1D NetFlow: +3,824 $BTC(+$320.43M)🟢
7D NetFlow: +28,862 $BTC(+$2.42B)🟢#Ethereum ETFs:
1D NetFlow: +49,304 $ETH(+$131.2M)🟢
7D NetFlow: +211,638 $ETH(+$563.17M)🟢 pic.twitter.com/dJ1u8RFYv7— Lookonchain (@lookonchain) September 24, 2026
BlackRock’s ETHA fund led the pack with $50.8 million. That’s nearly half of the day’s total inflow.
Fidelity’s FETH wasn’t far behind, pulling in $41.3 million on the same day.
Trading analyst Ted, known online as @TedPillows, shared his view on the current price action. He said ETH is having a slight correction and expects a retest of the $2,550 level before the price moves higher again.
$ETH is having a slight correction here.
IMO, a retest of the $2,550 level is highly likely before the upward continuation. pic.twitter.com/VQ2Pqtbnxu
— Ted (@TedPillows) September 24, 2026
Key Support Zone Being Tested
A separate analyst known as BATMAN pointed to the $2,560-$2,600 range as an important zone for ETH. This area used to act as resistance and has since been tested as support multiple times.
$ETH is heading back toward the key $2.56K–$2.60K zone. That was previous resistance and has flipped into support multiple times.
200 EMA sits around $2.46K below. Watching how Ethereum reacts as it gets there. pic.twitter.com/OlxVGqdqsB
— BATMAN ⚡ (@CryptosBatman) September 24, 2026
If ETH holds this zone during a pullback, it would confirm the old resistance has turned into support. The 200-day EMA sits nearby at around $2,460, giving traders another level to watch.
On the charts, ETH is trading above the middle Bollinger Band, which sits at $2,547.65. The upper band is at $2,767.17.
The MACD line sits at 96.50, above the signal line at 86.47. The histogram is positive at 10.02, though the gap between the lines is small.
Coinglass data shows $74.5 million in liquidations over the past 24 hours. Long liquidations made up $44.4 million of that total.
Resistance levels above the current price sit at $2,786 and $2,894, with a further barrier at $3,177.
On the macro side, Brent crude rose nearly 3% Thursday after US-Iran talks broke down. The US 10-year Treasury yield climbed above 5.15%, its highest level since June 2007.


