






TLDR
- ETH trades near $2,729, up about 1% after reaching an intraday high of $2,746
- Price has climbed from around $1,500 in June, forming higher lows along the way
- Bulls are testing the $2,750-$2,800 resistance zone, with $3,000 as the next target
- U.S. spot Ether ETFs pulled in roughly $690 million during the Sept. 21-25 week
- Citi raised its 12-month ETH price target from $2,240 to $3,028
Ethereum is trading near $2,729 on October 2, as buyers keep pressing toward the $2,750-$2,800 resistance area. The token opened the day around $2,705 and touched an intraday high of $2,746.
ETH was up roughly 1% on the daily candle at the time of the chart. The move extends a recovery that started back in June.
Since bottoming near $1,500, Ethereum has formed a steady pattern of higher lows. A rising trend line from that June low now points toward the $2,400 area, and price continues to trade comfortably above it.
During September, ETH broke through a resistance zone between $2,400 and $2,500. That zone had capped several earlier rallies, and traders now view it as a support region if the price pulls back.
Ethereum bulls target the $2,800 level
The current technical focus sits at $2,750-$2,800. ETH spent much of September consolidating between $2,450 and $2,600 before pushing higher again.
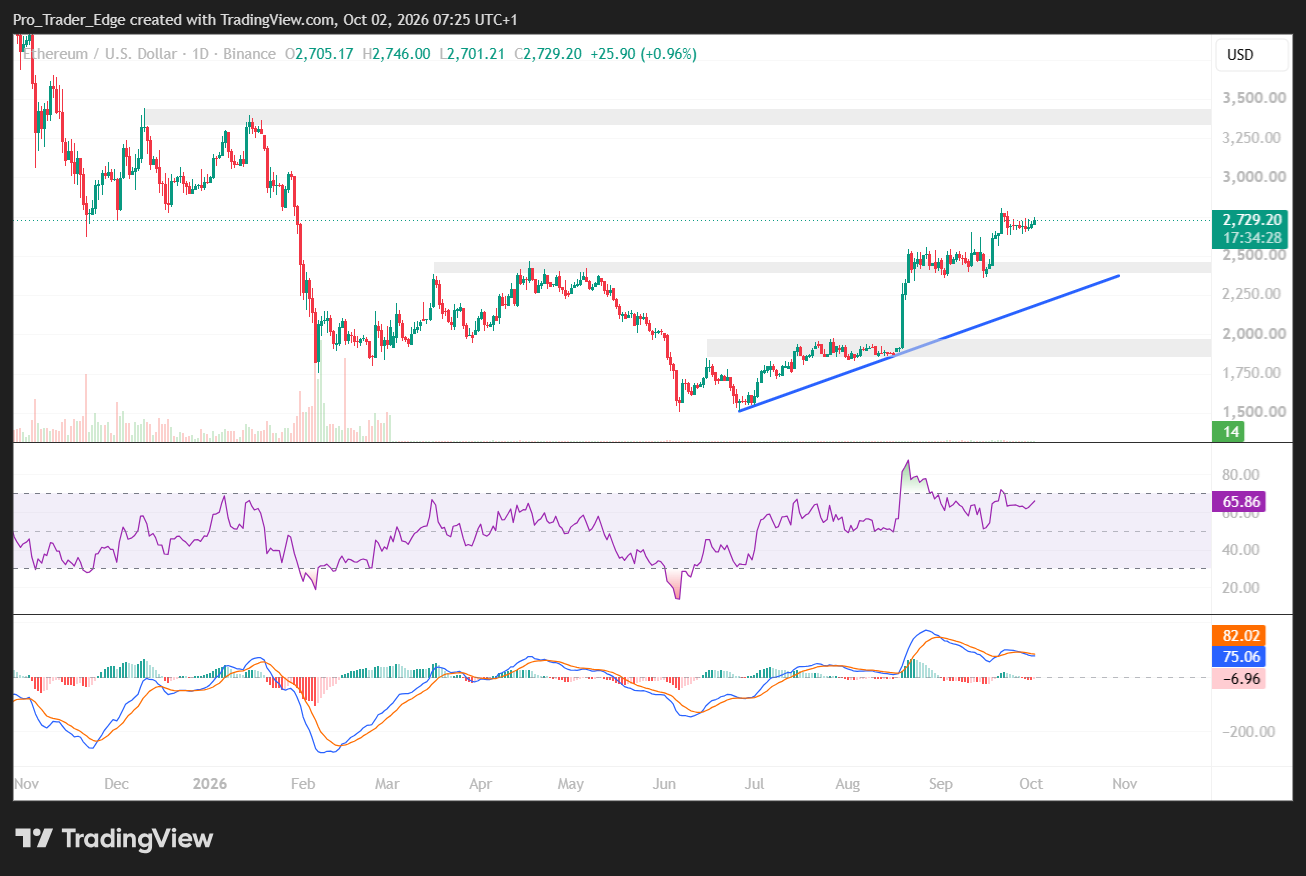
A daily close above $2,800 would confirm the breakout and bring the $3,000 level back into view. Above $3,000, chart resistance thickens again around $3,300-$3,450, a zone tied to price action before Ethereum’s decline earlier in the year.
On the downside, the first support sits around $2,450-$2,500. Below that, the rising trend line adds another layer of support near $2,400. A deeper drop would put $1,850-$2,000 back in focus, though ETH is currently well above that range.

Momentum remains positive but has cooled. The daily RSI sits at 65.86, above the neutral 50 mark but below the overbought threshold of 70.
MACD paints a more mixed picture in the short term. The MACD line is near 75.06, sitting below the signal line at 82.02, with the histogram slightly negative at about -6.96. That points to a rally that is intact but losing some speed near resistance.
Trader Michaël van de Poppe shared a similar read on the chart. He wrote that the same pattern seen elsewhere can be spotted on $ETH, adding that a break through resistance would make it “a matter of time” before ETH trades at $3,000.
The same picture can be seen on $ETH.
Break through the resistance, and it's going to be a matter of time until we'll see $ETH trading at $3,000. pic.twitter.com/3ttkXo6WN9
— Michaël van de Poppe (@CryptoMichNL) October 1, 2026
Ethereum ETF flows remain in focus
Institutional demand has picked back up after a softer stretch earlier in September. U.S. spot Ether ETFs brought in about $690 million during the Sept. 21-25 week, the strongest weekly total since late August.
BlackRock’s ETHA led the inflows with roughly $326 million. Fidelity’s FETH added about $174 million, and Grayscale’s Ethereum Mini Trust brought in close to $100 million.
Flows cooled again toward the end of September, with small outflows in the final sessions. Cumulative inflows still sit near $14 billion, a much stronger pace than earlier in 2026.
A technical catalyst is also approaching. The Glamsterdam upgrade is set for Sepolia testnet deployment in early October, aimed at improving execution efficiency, node syncing, and network scaling.
1/6
⚡ Ethereum confirms it: the Glamsterdam upgrade lands in Q4 2026.This isn't just "another improvement." It's the biggest capacity leap since The Merge — and it's going to change what it costs to use Ethereum.
A thread 🧵 pic.twitter.com/DH1iE55JyX
— dominioscripto.eth (@septiembre_eth) September 20, 2026
Citi raised its 12-month Ether price target from $2,240 to $3,028, pointing to stronger crypto activity and renewed ETF demand as reasons for the upgrade.
Ethereum remains above its rising daily trend line, trading close to $2,730 with RSI firm at 65.86 and bulls pressing against the $2,750-$2,800 resistance band.


