






TLDR
- Ethereum trades near $2,617 after slipping under the $2,600 mark
- The Glamsterdam upgrade launched on the Sepolia testnet on Tuesday
- Ethereum ETFs recorded six straight days of net outflows, totaling $207 million
- Over $400 million in long positions were liquidated within 20 minutes
- Analysts say a drop to the $2,400–$2,600 range is possible before a move toward $3,400
Ethereum (ETH) is changing hands around $2,617 after a sharp drop pulled the token below $2,600. The move followed a quiet week where price stayed stuck between $2,650 and $2,750.
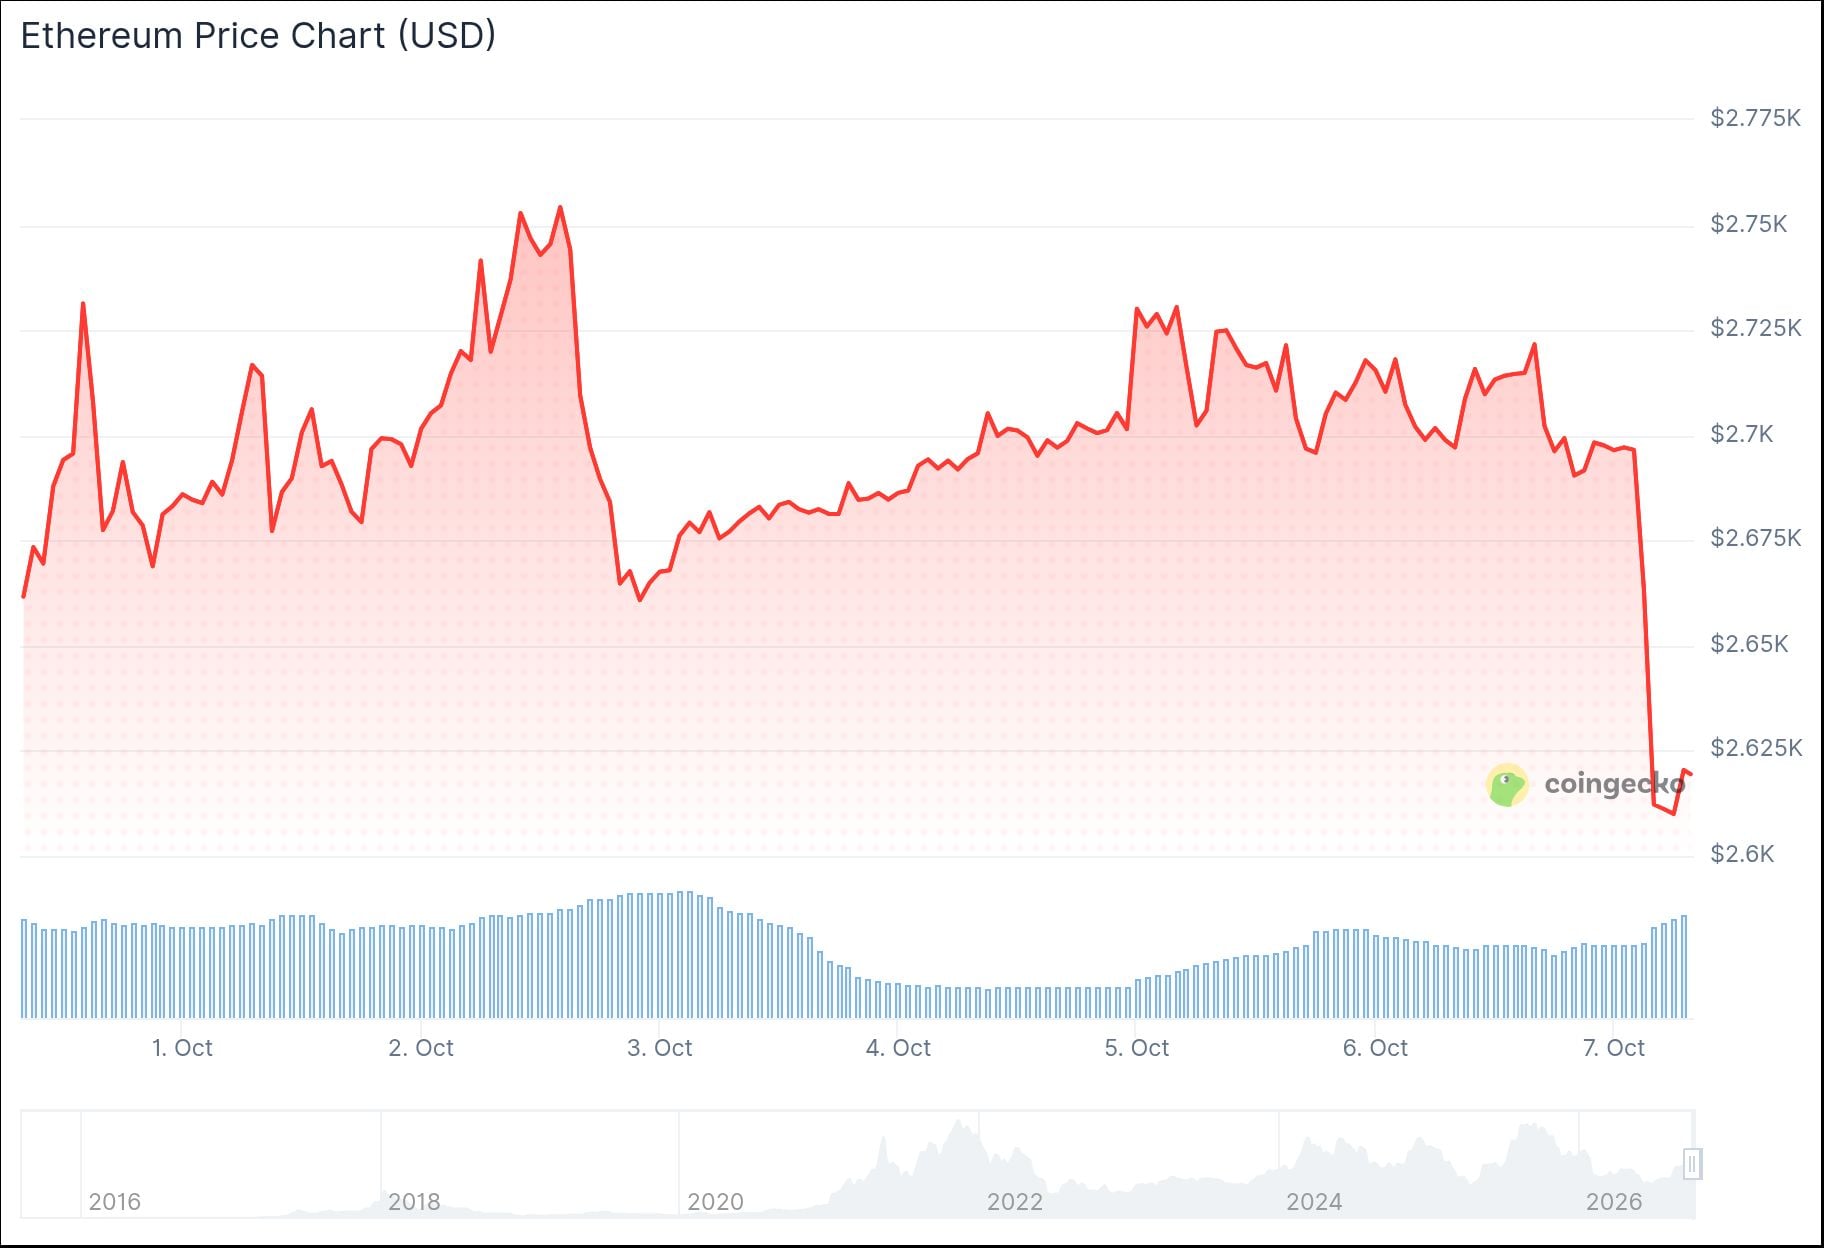
The drop came as Ethereum’s Glamsterdam upgrade launched on the Sepolia testnet on Tuesday. This is a key step before the upgrade can move to the mainnet.
Glamsterdam combines two separate upgrades, Amsterdam and Gloas. It includes 18 core proposals and 7 supporting ones, covering changes to how the network handles blocks and data.
LATEST: ⚡️ Ethereum's Glamsterdam upgrade has gone live on the Sepolia testnet. pic.twitter.com/cbHzLnlHUp
— CoinMarketCap (@CoinMarketCap) October 6, 2026
One of the biggest changes is a gas limit increase, moving from 60 million to 200 million. This lets the network process more transactions and heavier computations per block.
Ethereum co-founder Vitalik Buterin spoke at the OKX NOW event on Tuesday. He said onchain apps will lean more on AI over the next two years, with bots handling much of the front-end activity.
Price Action and Liquidations
The price drop triggered a wave of forced selling across the market. Analyst account Watcher.Guru posted that ETH fell under $2,600 as $400 million in crypto longs were liquidated in just 20 minutes.

JUST IN: $ETH falls under $2,600 as $400 million in crypto longs are liquidated in the past 20 minutes. pic.twitter.com/EV73C099gN
— Watcher.Guru (@WatcherGuru) October 7, 2026
Coinglass data shows $15.3 million in ETH liquidations over 24 hours, with $10.5 million coming from long positions. On the daily chart, ETH still holds above its 20-, 50-, and 100-day moving averages, which points to underlying demand even after the pullback.
Resistance sits near $2,781, followed by $3,075 and $3,260. Support levels sit at the 20-day average near $2,656, then $2,631, $2,558, and the 50-day average at $2,500.
ETF Outflows and On-Chain Data
Spot Ethereum ETFs have now posted six straight days of net outflows. Investors pulled $207 million from these funds over five days, the longest outflow streak since June.
Oct 6 Update:#Bitcoin ETFs:
1D NetFlow: -1,059 $BTC(-$91.72M)🔴
7D NetFlow: +1,074 $BTC(+$93M)🟢#Ethereum ETFs:
1D NetFlow: -21,432 $ETH(-$58.29M)🔴
7D NetFlow: -79,193 $ETH(-$215.37M)🔴 pic.twitter.com/eGBYPThNi2— Lookonchain (@lookonchain) October 6, 2026
This follows ETH’s climb from $2,400 to $2,800 in late September. The outflows suggest some early buyers are taking profits off the table.
Despite this, Ethereum’s MVRV Ratio climbed from 1.4% to 3.5% over the same period. This metric tracks the average cost basis of ETH holders and remains in positive territory.
Analysts have compared the current setup to April-May 2025, when ETH bottomed near $1,400 before rallying to a new all-time high after the Pectra upgrade. They say a similar pattern could play out if the $2,400 floor holds.
The Relative Strength Index for ETH sits above 50, pointing to a bullish lean that could support a move toward $3,400 if buyers return. As of 06:37 UTC on October 7, ETH was last quoted at $2,617.71, down 2.98% on the day.


