





TLDR
- SOL trades near $121, holding above its 20, 50, 100 and 200-day moving averages.
- The $125 level is the key resistance both daily and weekly charts are watching.
- Daily Chaikin Money Flow sits at 0.23, pointing to steady buying pressure.
- Solana’s DeFi TVL rose from about $5.6 billion to $6.7 billion between September and October.
- Open interest has climbed above $7 billion, with liquidation clusters forming near $115 and $125.
Solana was trading at $121.44 on Oct. 6, up 0.55% over the previous 24 hours. The token has spent the past several sessions moving sideways after a sharp recovery in September.
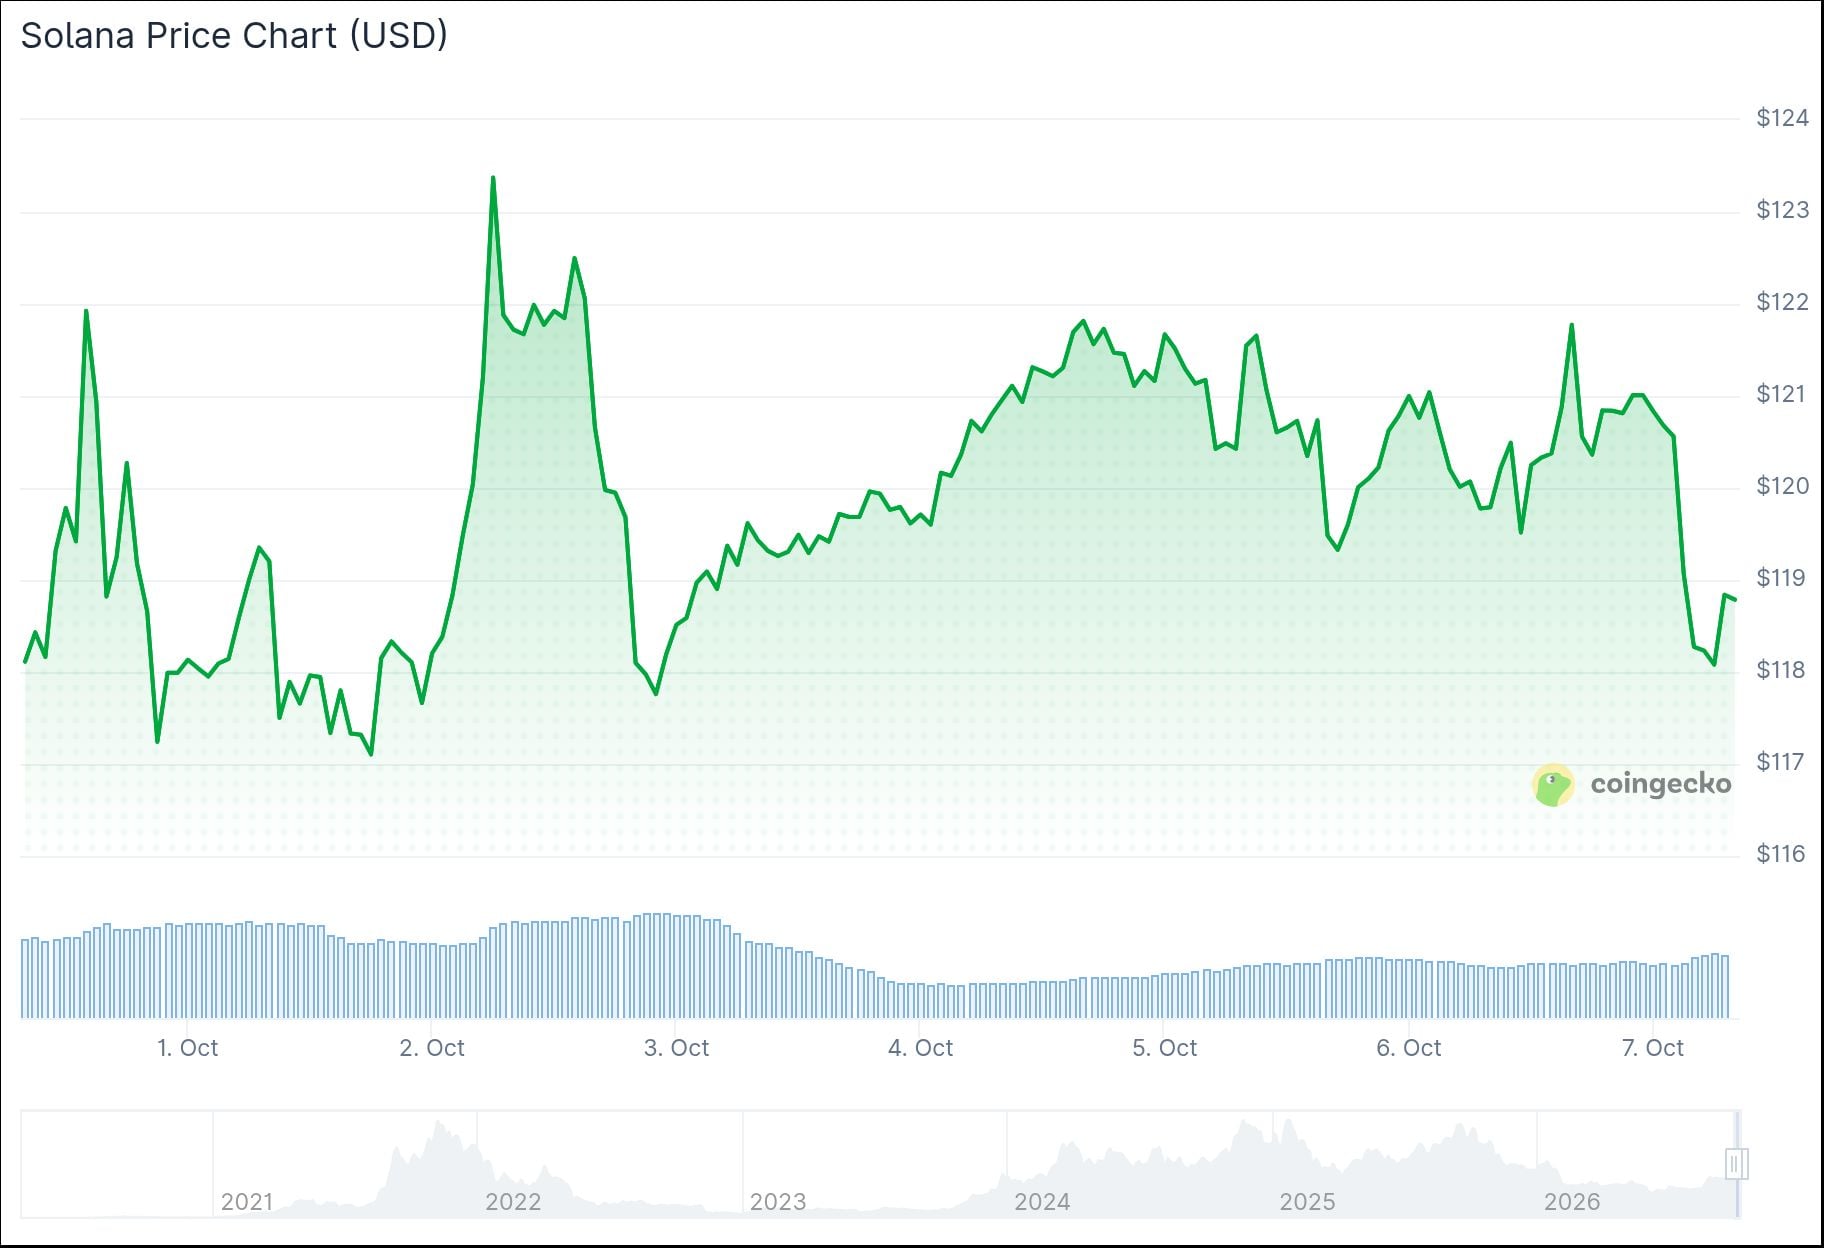
On the daily chart, SOL hit a high of $122 and a low of $118.88. That range has held steady for days, with the late-September peak acting as the nearest ceiling.
At current prices, SOL sits about 3.5% below the $125 level marked on the weekly chart. A move to $150 would require a gain of roughly 24% from here.
The daily chart shows SOL trading above its 20-day EMA at $116.39 and its 50-day EMA at $106.76. The 100-day and 200-day EMAs sit lower, at $97.77 and $96.60.
Weekly Chart Shows $125 as the Key Pivot
The weekly TradingView chart places $125 at the Murrey Math indicator’s main support and resistance pivot. SOL traded at $120.77 on that timeframe, just below the level.
The next Murrey Math level up sits at $156.25, marking the top of the current trading range. Below price, the matching lower boundary is $93.75.
Weekly ADX read 30.21. That measures trend strength, not direction, so it does not confirm a bullish or bearish October on its own.

One trader on X, Wealthmanager, described SOL as forming a tight triangle, with lower highs and higher lows squeezing the range smaller. The post noted no breakout had happened yet, but said the next move could be close.
$SOL is forming a tight triangle.
Price is making lower highs and higher lows as the range gets smaller.
No breakout yet. The next move could be close. pic.twitter.com/7akdUNGIXl
— Wealthmanager (@Wealthmanager) October 6, 2026
DeFi Activity and Open Interest Keep Climbing
DeFiLlama data shows Solana’s total value locked grew from around $5.6 billion in early September to about $6.7 billion in early October. Daily DEX volume and active addresses stayed elevated through the period.
CoinGlass data shows Solana open interest climbing above $7 billion toward the end of that stretch. Liquidations have hit both long and short positions as SOL trades near $121.
CoinGlass’s one-month liquidation heatmap shows clusters around $115 to $116 below current price. Further bands sit near $112 and $104 to $105.
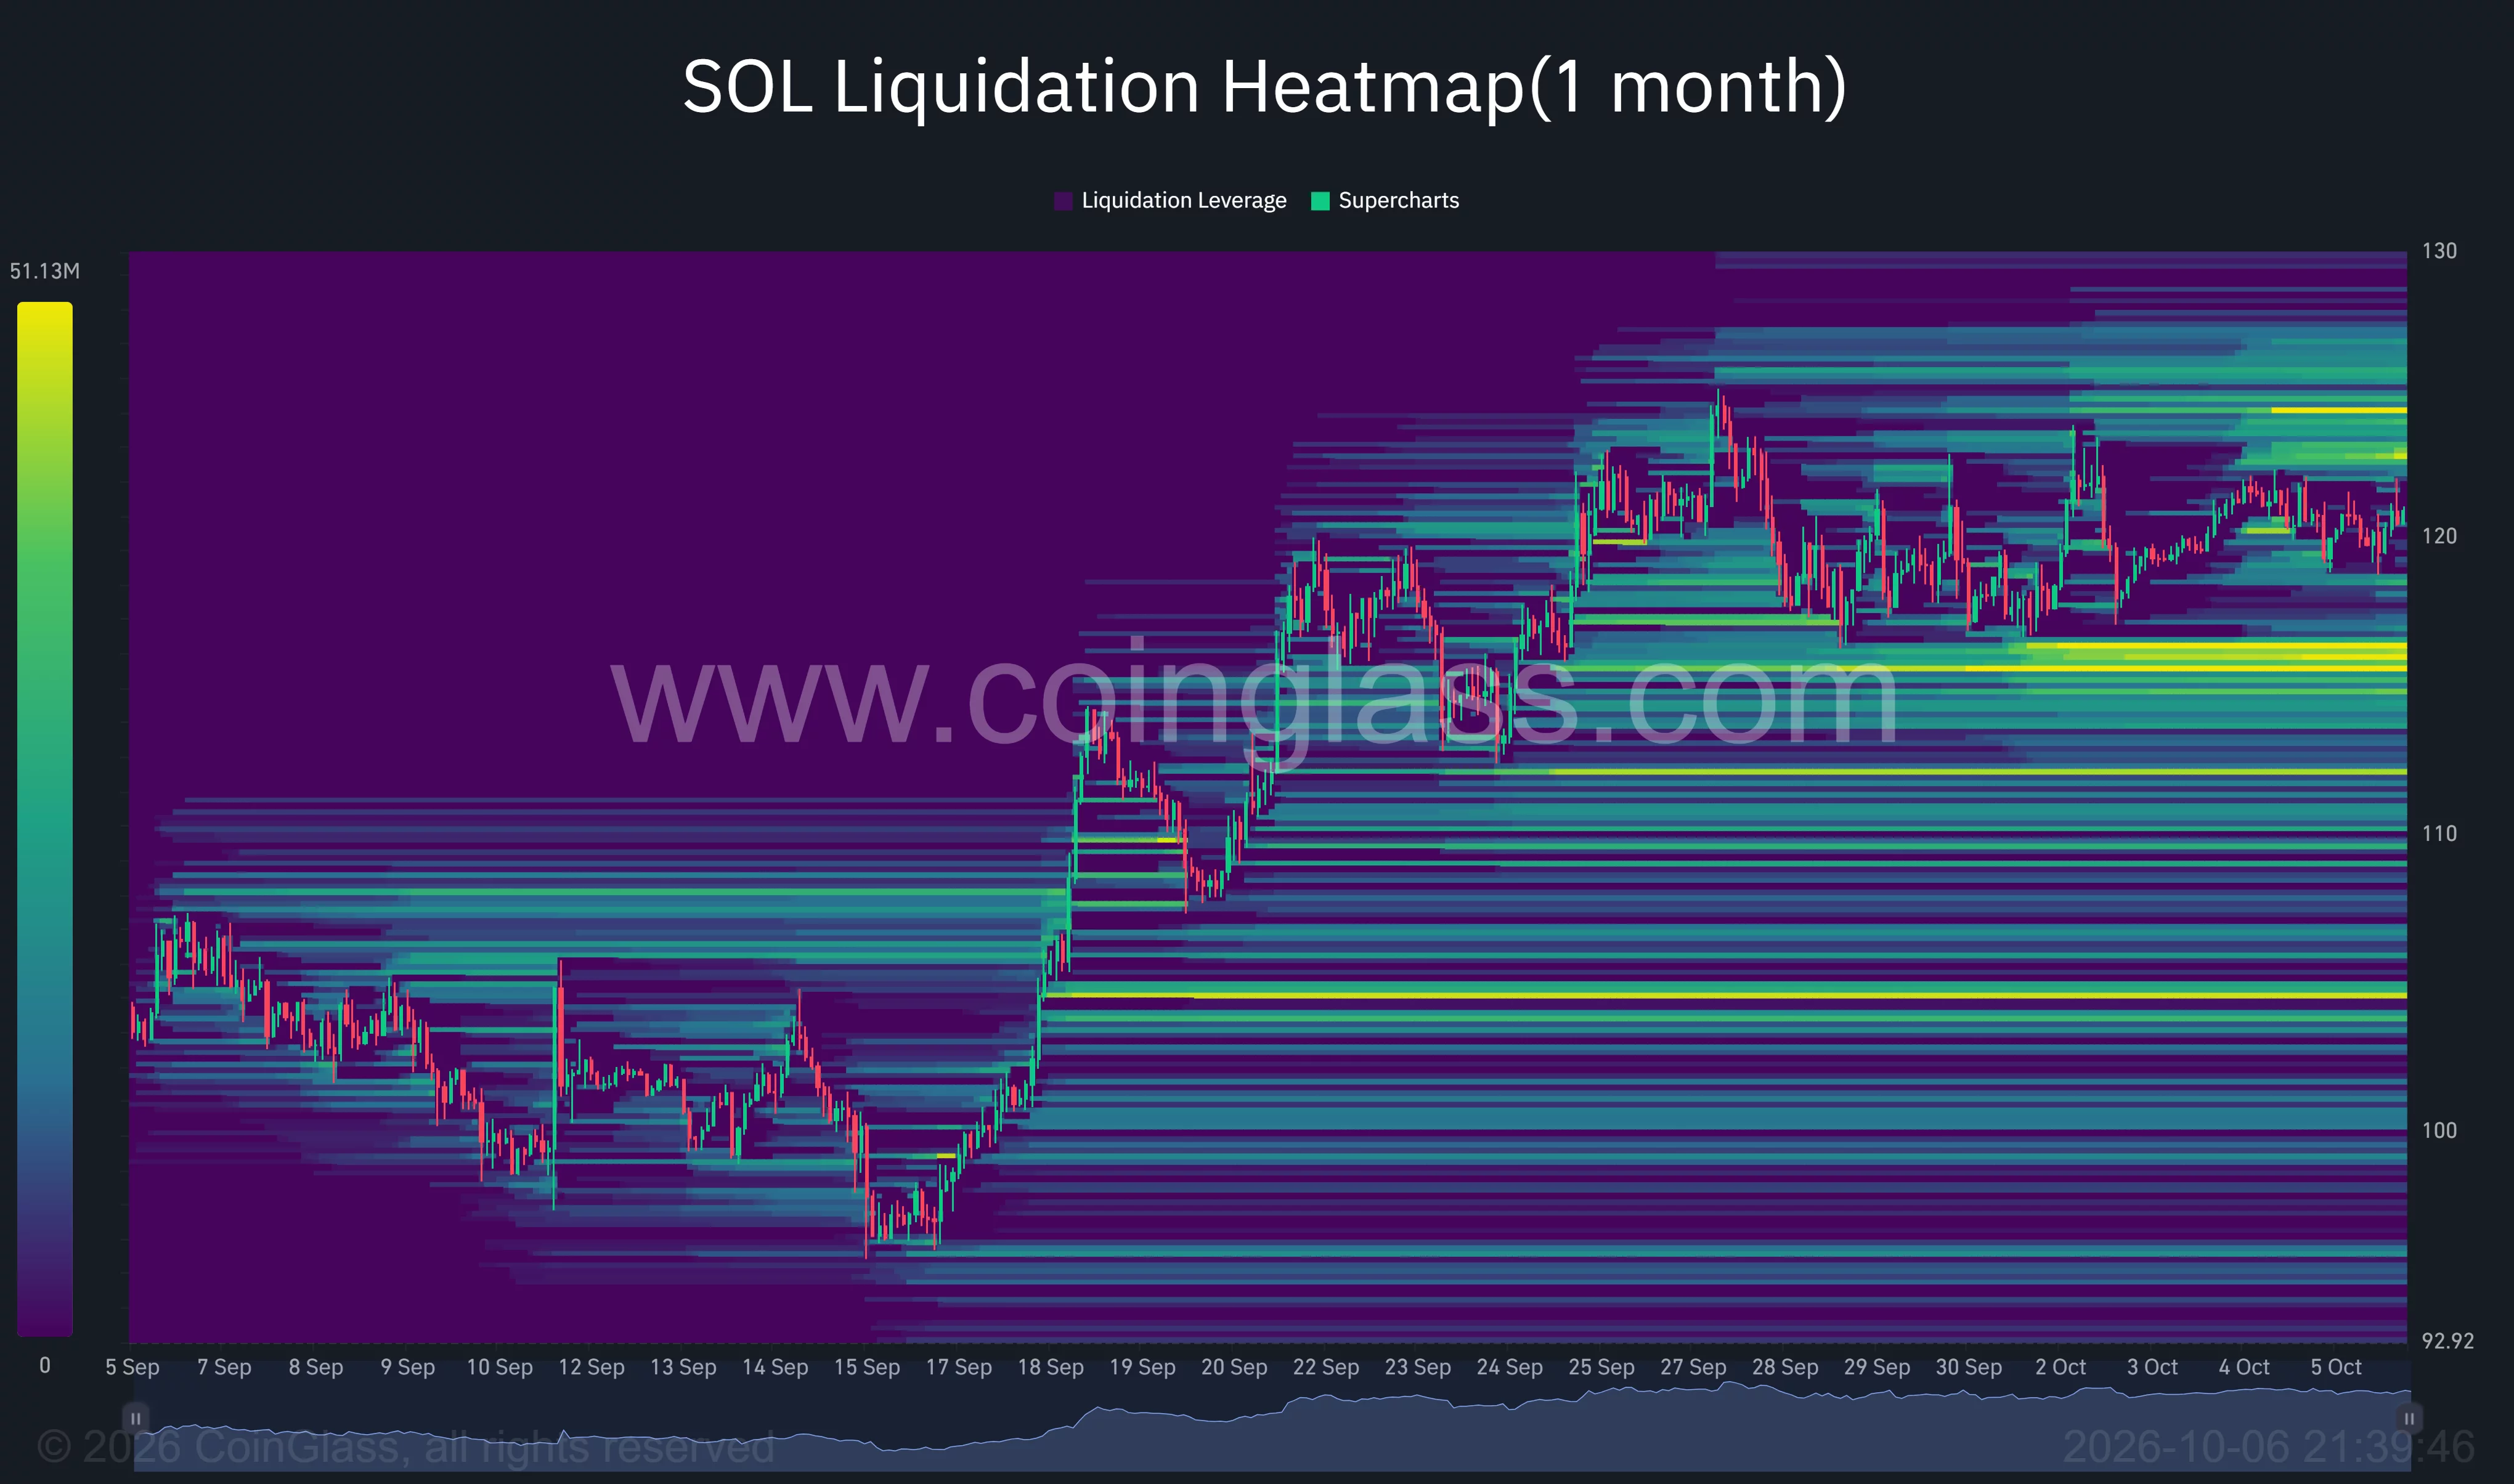
Above price, the heatmap shows clusters around $123 to $125, with more near $126 to $127. Those levels overlap the weekly $125 pivot.
The daily Supertrend indicator remained green at $107.22, about 11.3% below current price. SOL has stayed above that line through its latest consolidation.
$113.05 is marked as the key support level on the daily chart. A drop below that point could shift focus toward the lower moving averages.
Network activity has also moved forward. The Solana Foundation reported mainnet slot times reached 250 milliseconds on Sep. 18, with a further cut to 200 milliseconds scheduled for epoch 1052.


