






TLDR
- SUI trades near $1.20 after recovering from 2026 lows around $0.64.
- Analysts point to $1.35 as the key level for a possible breakout.
- SUI fell about 4.5% in 24 hours during a mildly weak altcoin market.
- SUI appears in large short positions linked to Abraxas Capital Management.
- Technical indicators stay mixed, with RSI sitting below the neutral 50 mark.
Sui (SUI) is trading near $1.20 after climbing back from its 2026 low around $0.64. The token has spent recent sessions stuck between support and resistance, leaving traders watching for a clear signal.
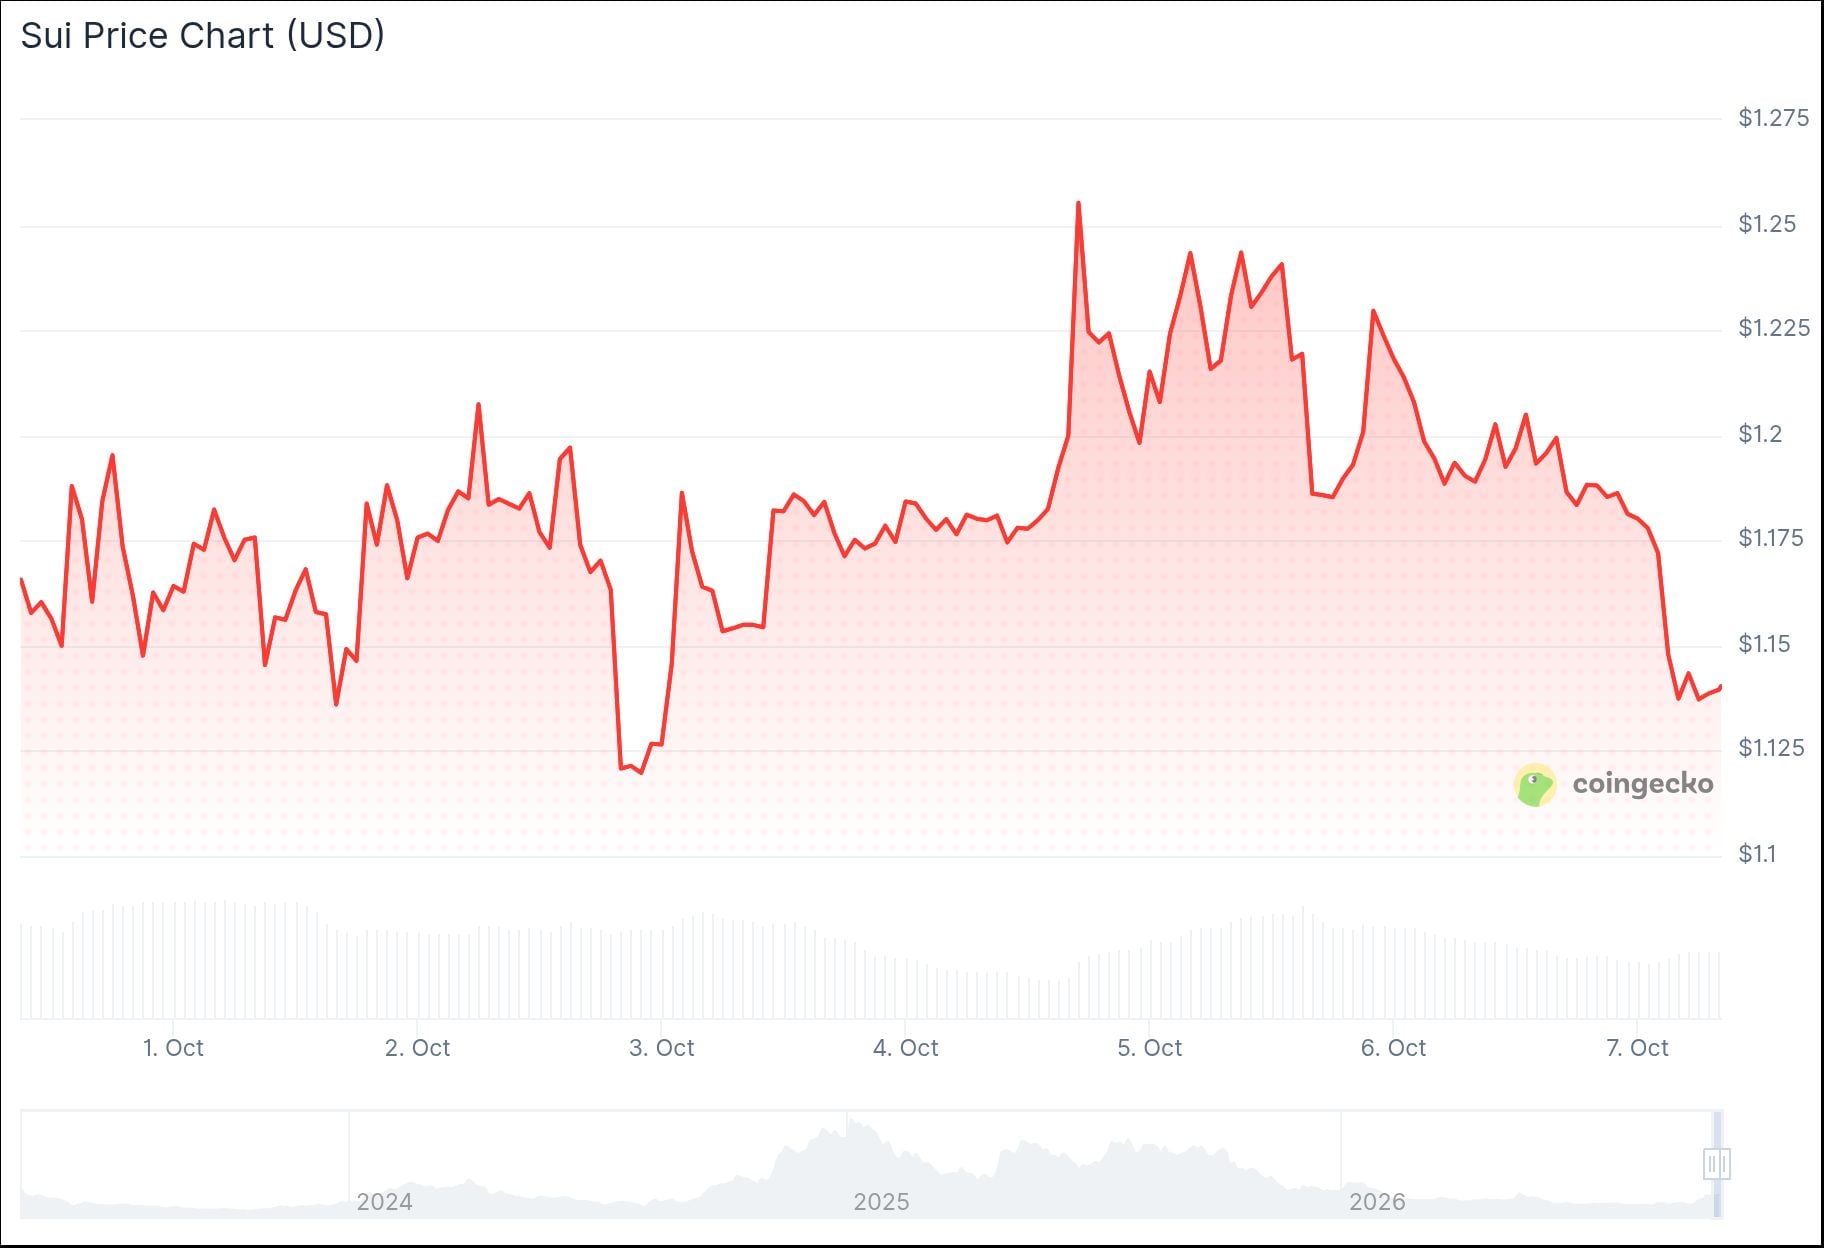
Price action has kept SUI inside the $1.15 to $1.25 range. Sellers have repeatedly stepped in whenever the token pushes toward the upper end of that band.
TradingView analyst Donatelio marks $1.139 as nearby support and $1.192 to $1.205 as the closest resistance. Buyers have defended pullbacks but have not held above $1.20 for long.
A move above $1.205 could open the door to $1.27 and then $1.309, according to that analysis. A drop below $1.139 without a quick recovery could send the price back toward $1.05 to $1.09.
Another TradingView contributor, Alawan11, sees a steadier structure on the four-hour chart. Buyers held the $1.10 to $1.15 zone during the last pullback.

That analyst sets $1.35 as the level to watch. A four-hour close above $1.30 to $1.35, followed by a retest, would be the clearer confirmation of further upside toward $1.50 and $1.65.
SUI Drops as Traders Rotate Out
SUI fell roughly 4.5% to 4.7% over 24 hours, with volume near $701 million. There is no single Sui-specific news event tied to the drop.

The broader altcoin market cap slipped about 2% over the same window, so SUI is not falling alone. It is simply underperforming a softer tape.
Two large wallets linked to Abraxas Capital Management hold close to $1.58 billion in net shorts across several major tokens, including SUI. Analysts note these could be hedges rather than directional bets.
Some traders have also floated a long NEAR, short SUI pairing, arguing NEAR has fresher inflows while SUI has already had its run. That idea has circulated on social media this week.
Technical Indicators Stay Mixed
The 14-period RSI sits near 43, below the neutral 50 line. The Stochastic indicator reads around 25, and the MACD is slightly negative.
SUI trades below its 10-, 20-, and 50-period moving averages. The 100- and 200-period averages sit lower and may offer support.
On the longer-term chart, SUI is retesting a descending trendline that has capped price since levels near $4.40, according to analyst CryptoNuclear. A two-day close above that line would be needed to shift the broader trend.
Trader Ted, who posts as @TedPillows, said Sui is being built into AI agent verification tools through Mysten Labs and Google Cloud. He added that $SUI has been ranging in a bullish channel and that a four-hour close above $1.25 could trigger the next move up.
Sui will play a big role in how companies use AI agents.
Mysten Labs and Google Cloud are building a way to verify that AI agents did only what they were allowed to do.
And @SuiNetwork is part of the system that records that proof.
Looking at the $SUI chart, it has been… pic.twitter.com/ZoVBfBZHms
— Ted (@TedPillows) October 6, 2026
Bitcoin ETFs recorded about $90 million in net outflows this week, and Ether ETFs remain on a multi-day outflow streak. Crypto market sentiment still reads as “Greed” on fear and greed indices, with total market cap near $2.85 trillion.


