






Bitcoin exchange-traded funds changed how millions of people invest in crypto. Since the first US spot Bitcoin ETFs launched on January 11, 2024, these products have attracted tens of billions of dollars in cumulative net inflows from retail and institutional investors.
This article compiles the latest data on Bitcoin ETF assets, daily flows, fee structures, long-term performance, and the parallel European exchange-traded product market. All figures are as of October 8, 2026, unless otherwise stated.
The growth of these funds has been fast. From a standing start in January 2024, total net assets across US Bitcoin spot ETFs now sit at $111.09 billion. That figure places the combined funds among the largest pools of Bitcoin held by financial institutions anywhere in the world.
| Metric | Value | Context |
|---|---|---|
| Total Net Inflow (USD) | +$57.79B | Since Jan 11, 2024 |
| Total Net Inflow (BTC) | +721,710 BTC | Since Jan 11, 2024 |
| Total Net Assets | $111.09B | As of Oct 8, 2026 |
| Daily Trading Volume | $3.58B | Oct 8, 2026 |
| Daily Net Flow (Oct 7) | -$484.9M | Largest since Jun 25, 2026 |
| October 2026 Net Flow (to date) | -$165.6M | Through Oct 7 |
| September 2026 Net Flow | +$2.65B | Full month total |
| 90-Day Average Daily Flow | ~+$92M | Inflow average |
Table 1: Key US Bitcoin ETF statistics as of October 8, 2026. Source: SoSoValue, Farside Investors, CoinDesk.
The path to $57.79 billion was not smooth. Cumulative net flows turned negative in mid-2026, reaching a low of -$5.76 billion in July before recovering sharply in August and September. The recovery shows how quickly sentiment can shift in this market.
So far in 2026, the total year-to-date net flow stands at just $717 million, which is a thin margin above zero given the cumulative totals involved. The bulk of the all-time inflow came in 2024, when the funds were new and demand from institutional allocators was high.
The Largest US Bitcoin ETFs by Assets
BlackRock’s iShares Bitcoin Trust (IBIT) stands well above every other fund. It holds $68.67 billion in assets, which is more than four times the size of second-place Fidelity FBTC at $15.66 billion.

IBIT’s dominance reflects BlackRock’s ability to distribute products through large brokerage platforms, wirehouses, and registered investment advisors. The fund launched on the same day as nine competitors in January 2024 but quickly pulled ahead.
Grayscale’s original Bitcoin Trust (GBTC), once the only large-scale institutional Bitcoin product, has faced steady outflows since converting to an ETF in January 2024. Its 1.50% annual fee is the highest among spot Bitcoin ETFs and has driven many investors toward cheaper alternatives.
| Ticker | Fund | AUM | BTC Held | Annual Fee | Type |
|---|---|---|---|---|---|
| IBIT | iShares Bitcoin Trust (BlackRock) | $68.67B | 785,640 | 0.25% | Spot |
| FBTC | Fidelity Wise Origin Bitcoin Fund | $15.66B | 176,510 | 0.25% | Spot |
| GBTC | Grayscale Bitcoin Trust ETF | $10.56B | 126,580 | 1.50% | Spot |
| BTC | Grayscale Bitcoin Mini Trust | $5.42B | 142,230 | 0.15% | Spot |
| BITB | Bitwise Bitcoin ETF | $3.13B | 69,130 | 0.20% | Spot |
| ARKB | ARK 21Shares Bitcoin ETF | $2.87B | 100,920 | 0.21% | Spot |
| BITO | ProShares Bitcoin ETF | $1.71B | 158,890 | N/A | Futures |
| HODL | VanEck Bitcoin ETF | $1.22B | 51,930 | N/A | Spot |
| BRRR | Coinshares Bitcoin ETF | $475.6M | 20,250 | 0.25% | Spot |
| EZBC | Franklin Bitcoin ETF | $467.1M | 9,700 | 0.19% | Spot |
| BTCO | Invesco Galaxy Bitcoin ETF | $439.8M | 5,190 | 0.39% | Spot |
| BTCW | WisdomTree Bitcoin Fund | $181.7M | 1,990 | 0.30% | Spot |
Table 2: Top US Bitcoin ETFs by AUM, October 8, 2026. Source: SoSoValue, ETF Database.
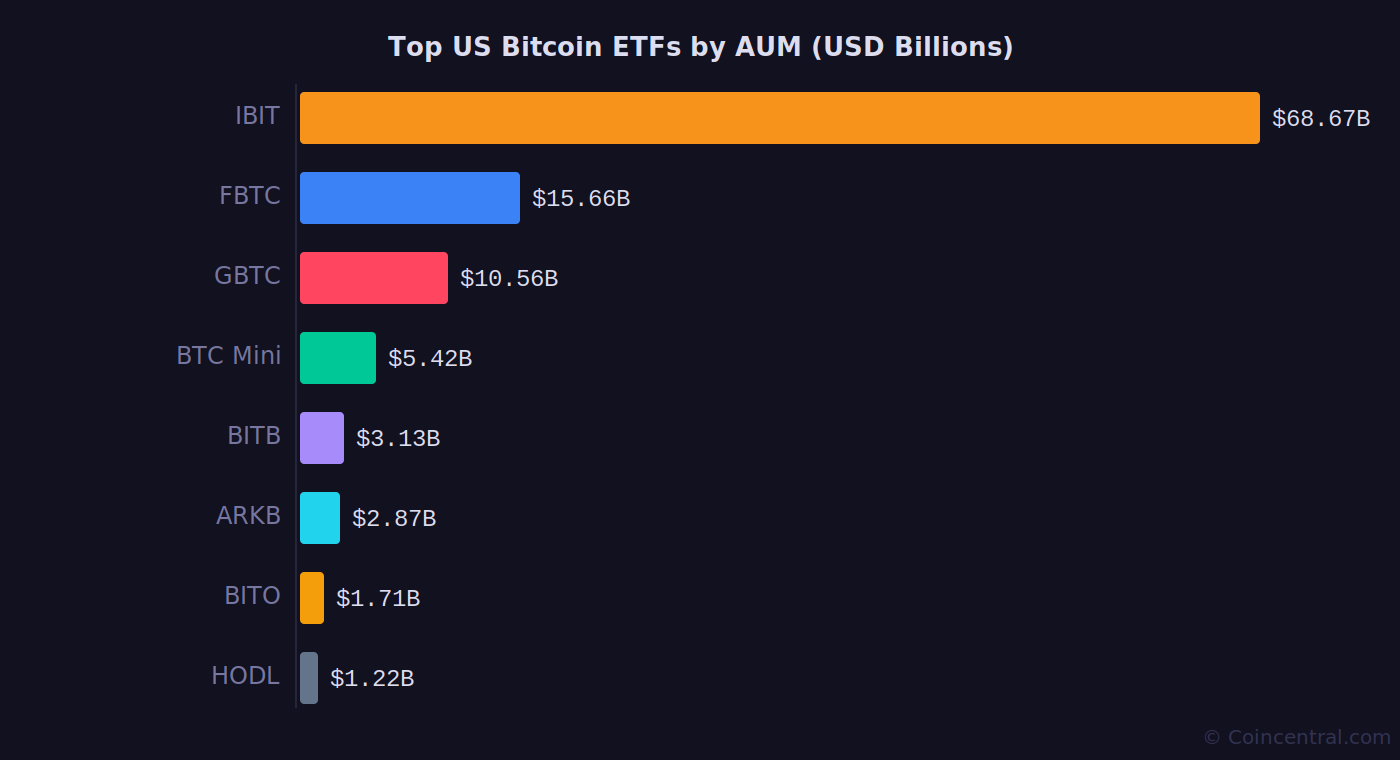
Chart 1: Top US Bitcoin ETFs by assets under management. Source: SoSoValue.
Grayscale launched its Bitcoin Mini Trust (BTC) as a low-fee alternative to GBTC. The Mini Trust charges just 0.15% per year and has gathered $5.42 billion in assets. It holds 142,230 BTC, which is more Bitcoin than ARKB despite having a smaller dollar AUM, due to price differences at time of purchase.
The Morgan Stanley Bitcoin Trust (MSBT) has also grown quickly, with $903.8 million in assets, according to ETF Database. It was not included in the table above but is part of the broader US Bitcoin ETF landscape. Its average daily volume was not publicly available as of this report.
Daily Net Flows: September and October 2026
Bitcoin ETF flows in late September and early October 2026 followed a clear arc: a strong start, a slow fade, and then a sharp reversal. September 21 saw the largest daily inflow of the period at $999 million. By October 7, the funds recorded a single-day outflow of $484.9 million.
The data from Farside Investors shows how quickly the tide turned. After about $2.65 billion in net inflows during September, October is already $165.6 million in the red through October 7.
Flows have been volatile in six-session stretches. Between October 1 and October 7, the market swung between small inflows and outflows on consecutive days before the October 7 outflow broke sharply lower.
| Date | Total Net Flow | Direction | IBIT Flow | FBTC Flow |
|---|---|---|---|---|
| Sep 21, 2026 | +$999.0M | Inflow | +$381.4M | +$238.8M |
| Sep 22, 2026 | +$714.7M | Inflow | +$350.3M | +$257.4M |
| Sep 23, 2026 | +$346.9M | Inflow | +$166.3M | +$143.2M |
| Sep 24, 2026 | +$190.7M | Inflow | +$162.6M | +$12.9M |
| Sep 25, 2026 | +$134.5M | Inflow | +$97.0M | +$49.3M |
| Sep 28, 2026 | +$31.0M | Inflow | +$54.8M | -$10.9M |
| Sep 29, 2026 | +$66.2M | Inflow | +$51.1M | $0 |
| Sep 30, 2026 | -$148.7M | Outflow | -$9.5M | -$125.6M |
| Oct 1, 2026 | +$102.7M | Inflow | +$195.6M | -$60.7M |
| Oct 2, 2026 | +$189.9M | Inflow | +$158.2M | +$29.3M |
| Oct 5, 2026 | -$89.8M | Outflow | +$69.9M | -$74.5M |
| Oct 6, 2026 | +$118.8M | Inflow | +$122.0M | $0 |
| Oct 7, 2026 | -$484.9M | Outflow | -$207.7M | -$105.1M |
Table 3: Daily Bitcoin ETF net flows, Sep 21 to Oct 7, 2026. Source: Farside Investors.
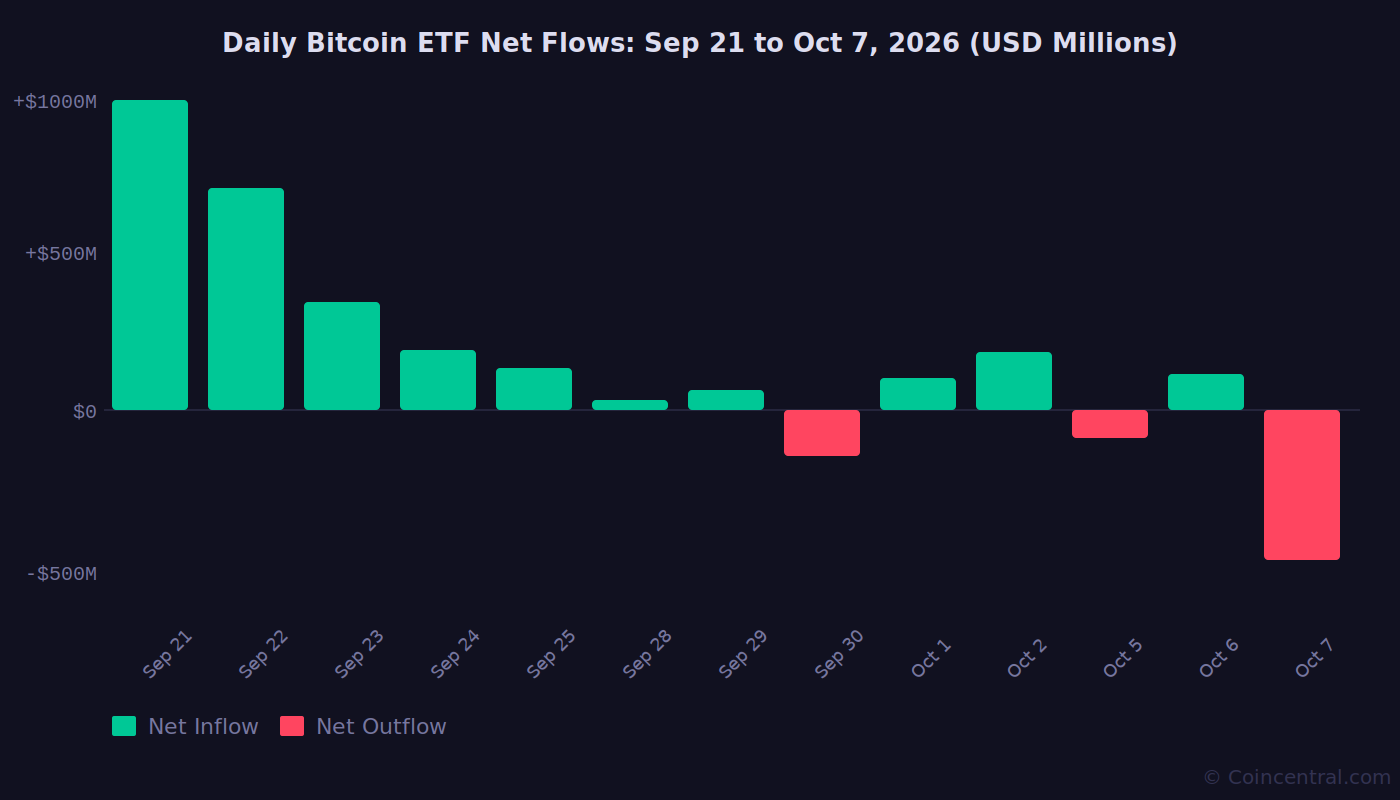
Chart 2: Daily Bitcoin ETF net flows, Sep 21 to Oct 7, 2026. Source: Farside Investors.
The chart shows a clear downward trend in inflows across the second half of September. The massive $999 million inflow on September 21 was followed by smaller and smaller daily totals, with the first significant outflow arriving on September 30.
October started with a recovery attempt but never regained the momentum of mid-September. The gap between the September 21 peak and the October 7 trough of -$484.9 million shows just how fast ETF sentiment can change.
The October 7 Outflow in Context
On October 7, 2026, US spot Bitcoin ETFs recorded net outflows of $484.9 million, according to SoSoValue data. CoinDesk reported the figure as $487.1 million, with the difference due to rounding and data timing. Either way, it was the largest single-day outflow since June 25, 2026.
Statistically, the day was an outlier. The outflow was 2.1 standard deviations below the 90-day average daily inflow of approximately $92 million. In a normal distribution, roughly 95% of observations fall within two standard deviations of the mean. A reading beyond that threshold places October 7 in the bottom 2 to 3% of all daily outcomes over that period.
The day’s losses were spread across multiple funds. BlackRock’s IBIT accounted for the largest portion at $207.7 million, or about 43% of the total outflow on its own.
| Fund (Ticker) | Issuer | Oct 7 Flow (USD M) | Share of Total |
|---|---|---|---|
| IBIT | BlackRock | -$207.7M | 42.8% |
| FBTC | Fidelity | -$105.1M | 21.7% |
| ARKB | ARK / 21Shares | -$101.7M | 21.0% |
| GBTC | Grayscale | -$39.3M | 8.1% |
| BITB | Bitwise | -$27.6M | 5.7% |
| HODL | VanEck | -$3.5M | 0.7% |
| Total | -$484.9M | 100% | |
Table 4: October 7, 2026 Bitcoin ETF outflows by fund. Source: Farside Investors.
Bitcoin was trading around $83,000 during the outflow session. Analysts pointed to the $80,500 to $81,500 range as a key support zone, with the 50-day moving average sitting in the same area. A break below that level could expose $80,000 and disrupt the broader uptrend.
Context from earlier in the year matters here. The all-time maximum single-day outflow across all funds was $1.11 billion. October 7’s -$484.9 million was large but did not reach that extreme. The maximum single-day inflow recorded was $1.37 billion.
The contrast with September is sharp. The month of September saw positive daily flows on all but one day. October is already struggling to find consistent buying interest, which analysts have flagged as a concern given that Bitcoin needs sustained ETF demand to break above its recent resistance levels.
Fee Comparison: What Each Fund Charges
Management fees in the US Bitcoin ETF market range from 0.15% to 1.50% per year for spot products. That is a ten-fold difference between the cheapest and most expensive options. Over multiple years, this gap can take a meaningful bite out of returns.
Most of the funds that launched in January 2024 priced their fees below 0.25% to attract investors away from GBTC’s much higher rate. Franklin’s EZBC at 0.19% and Bitwise’s BITB at 0.20% are among the most competitively priced.
The Grayscale Bitcoin Mini Trust (BTC) charges 0.15%, which is the lowest fee among spot products from a major issuer. Grayscale launched it specifically to give investors an alternative to GBTC within the Grayscale family.
| Ticker | Fund | Annual Fee | AUM |
|---|---|---|---|
| GBTC | Grayscale Bitcoin Trust ETF | 1.50% | $10.56B |
| BTCO | Invesco Galaxy Bitcoin ETF | 0.39% | $439.8M |
| BTCW | WisdomTree Bitcoin Fund | 0.30% | $181.7M |
| IBIT | iShares Bitcoin Trust (BlackRock) | 0.25% | $68.67B |
| FBTC | Fidelity Wise Origin Bitcoin Fund | 0.25% | $15.66B |
| BRRR | Coinshares Bitcoin ETF | 0.25% | $475.6M |
| ARKB | ARK 21Shares Bitcoin ETF | 0.21% | $2.87B |
| BITB | Bitwise Bitcoin ETF | 0.20% | $3.13B |
| EZBC | Franklin Bitcoin ETF | 0.19% | $467.1M |
| BTC | Grayscale Bitcoin Mini Trust | 0.15% | $5.42B |
Table 5: US spot Bitcoin ETF annual expense ratios ranked by fee. Source: SoSoValue, ETF Database.
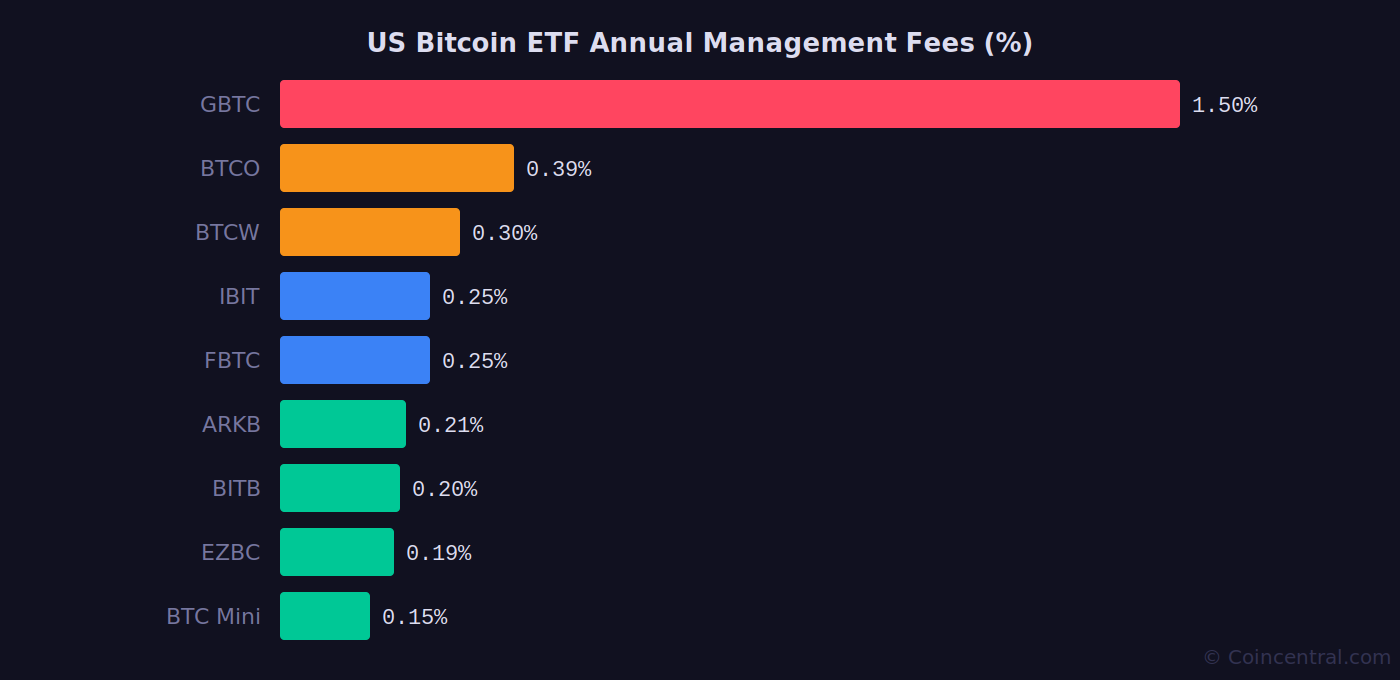
Chart 3: US Bitcoin ETF annual expense ratios from highest to lowest. Source: ETF Database.
Fee competition has been a defining feature of this market since day one. Most funds waived fees for an introductory period after launch, then settled into their permanent rates. The market has largely converged around 0.20% to 0.25% for the major spot products.
GBTC’s persistent outflows confirm that fee-sensitive investors are paying attention. The fund has seen a total net outflow of $27.94 billion since converting to ETF format. Much of that money appears to have moved into IBIT, FBTC, and other lower-cost alternatives.
The European Bitcoin ETP Market
European investors cannot access Bitcoin ETFs in the traditional sense. EU regulations known as UCITS rules require investment funds to hold a diversified basket of assets. A single-asset Bitcoin fund does not qualify under these rules, unlike in the US.
Instead, European investors use exchange-traded notes (ETNs) and exchange-traded products (ETPs) that are physically backed by Bitcoin. These products hold real Bitcoin on behalf of investors and are listed on European exchanges, but they are structured differently from ETFs under local securities law.
The three largest European products are run by CoinShares, WisdomTree, and iShares. All three charge 0.15% per year and hold between 1,386 million euros and 1,618 million euros in assets. These figures are a fraction of what IBIT alone holds, showing how much larger the US market is.
| ETP Name | Fund Size (EUR M) | Annual Fee | Domicile | Structure |
|---|---|---|---|---|
| CoinShares Physical Bitcoin | 1,618 | 0.15% | Jersey | Physically backed |
| WisdomTree Physical Bitcoin | 1,491 | 0.15% | Jersey | Physically backed |
| iShares Bitcoin ETP | 1,386 | 0.15% | Switzerland | Physically backed |
| Bitwise Physical Bitcoin ETP | 824 | 2.00% | Germany | Physically backed |
| 21shares Bitcoin ETP | 615 | 1.49% | Switzerland | Physically backed |
| 21shares Bitcoin Core ETP | 589 | 0.10% | Switzerland | Physically backed |
| VanEck Bitcoin ETN | 528 | 1.00% | Liechtenstein | Physically backed |
| Fidelity Physical Bitcoin ETP | 318 | 0.25% | Germany | Physically backed |
| Invesco Physical Bitcoin | 283 | 0.10% | Jersey | Physically backed |
| Bitwise Core Bitcoin ETP | 197 | 0.05% | Germany | Physically backed |
Table 6: Top European Bitcoin ETPs by fund size. Source: justETF, as of October 7, 2026.
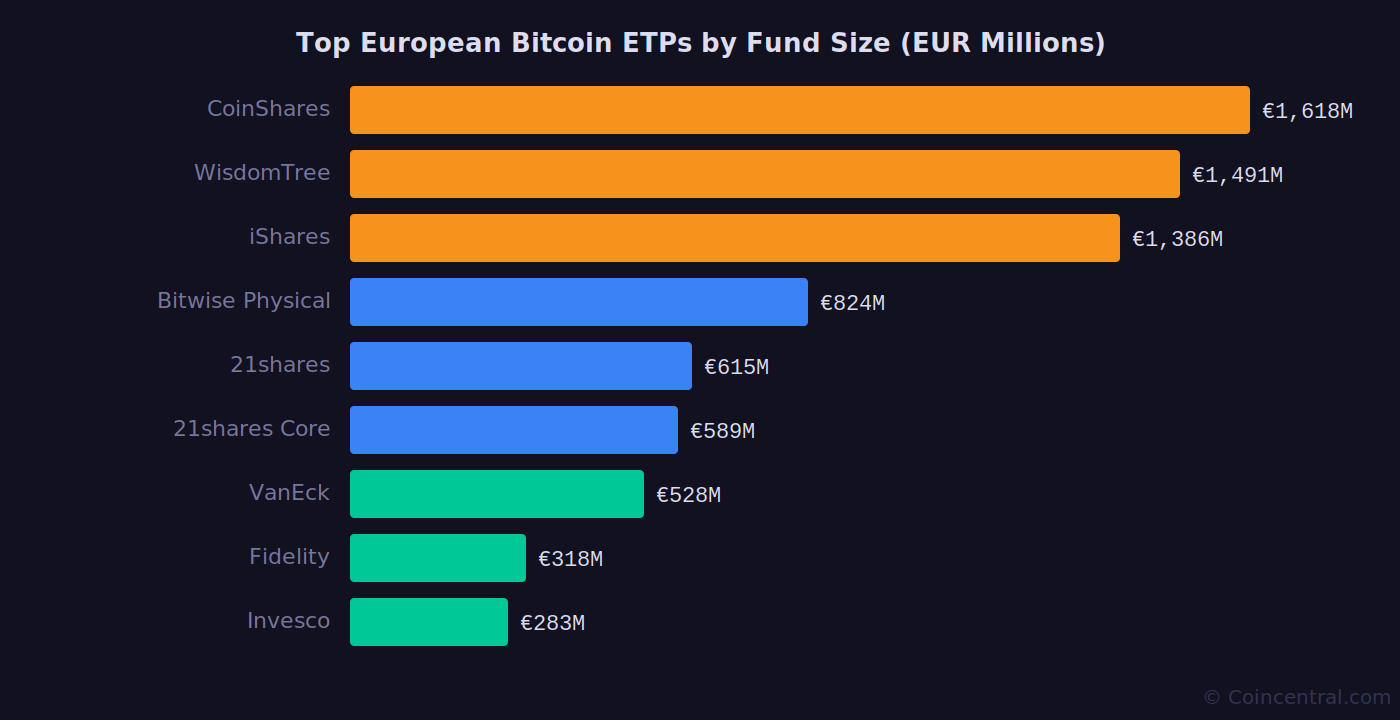
Chart 4: Top European Bitcoin ETPs by assets under management. Source: justETF.
The fee range in Europe is wider than in the US. Bitwise Physical Bitcoin ETP charges 2.00%, the highest among physically backed products anywhere. At the other end, the Bitwise Core Bitcoin ETP charges just 0.05%, lower than any US spot ETF.
The 21shares Bitcoin ETP and Bitcoin Core ETP are from the same issuer but charge very different fees: 1.49% versus 0.10%. The Core product launched later and was priced to compete with the cheapest options on the market, while the original product has kept its higher fee.
Bitcoin ETP Performance by Time Period
All European Bitcoin ETPs have posted negative 12-month returns through early October 2026. Bitcoin’s price declined from peaks reached in late 2025, pulling every physically backed product lower regardless of fee level.
The best one-year performer is 1Valour Bitcoin Physical Staking at -22.54%. This product includes a Bitcoin staking return component that offsets some of the price loss and fee drag. The worst performer is Bitwise Physical Bitcoin ETP at -25.09%, largely due to its high 2.00% annual fee.
Over three months, the picture is better. Nearly all products returned between 43% and 46% in the three months through early October 2026. This reflects a strong recovery in Bitcoin’s price during July through September 2026.
| ETP Name | 1 Month | 3 Months | 1 Year | 3 Years |
|---|---|---|---|---|
| 1Valour Bitcoin Physical Staking | +8.91% | +44.74% | -22.54% | N/A |
| VanEck Bitcoin ETN | +9.77% | +45.61% | -23.24% | +185.62% |
| Bitwise Core Bitcoin ETP | +8.88% | +43.19% | -23.41% | N/A |
| Invesco Physical Bitcoin | +8.76% | +43.27% | -23.48% | +188.55% |
| WisdomTree Physical Bitcoin | +8.82% | +43.07% | -23.54% | +188.71% |
| iShares Bitcoin ETP | +8.70% | +43.11% | -23.55% | N/A |
| CoinShares Physical Bitcoin | +8.75% | +43.22% | -23.58% | +188.24% |
| 21shares Bitcoin Core ETP | +8.77% | +43.29% | -23.73% | +189.64% |
| Fidelity Physical Bitcoin ETP | +7.77% | +44.20% | -23.95% | +187.25% |
| Bitwise Physical Bitcoin ETP | +8.01% | +43.59% | -25.09% | +173.87% |
Table 7: European Bitcoin ETP cumulative returns by period. Source: justETF, October 7, 2026.
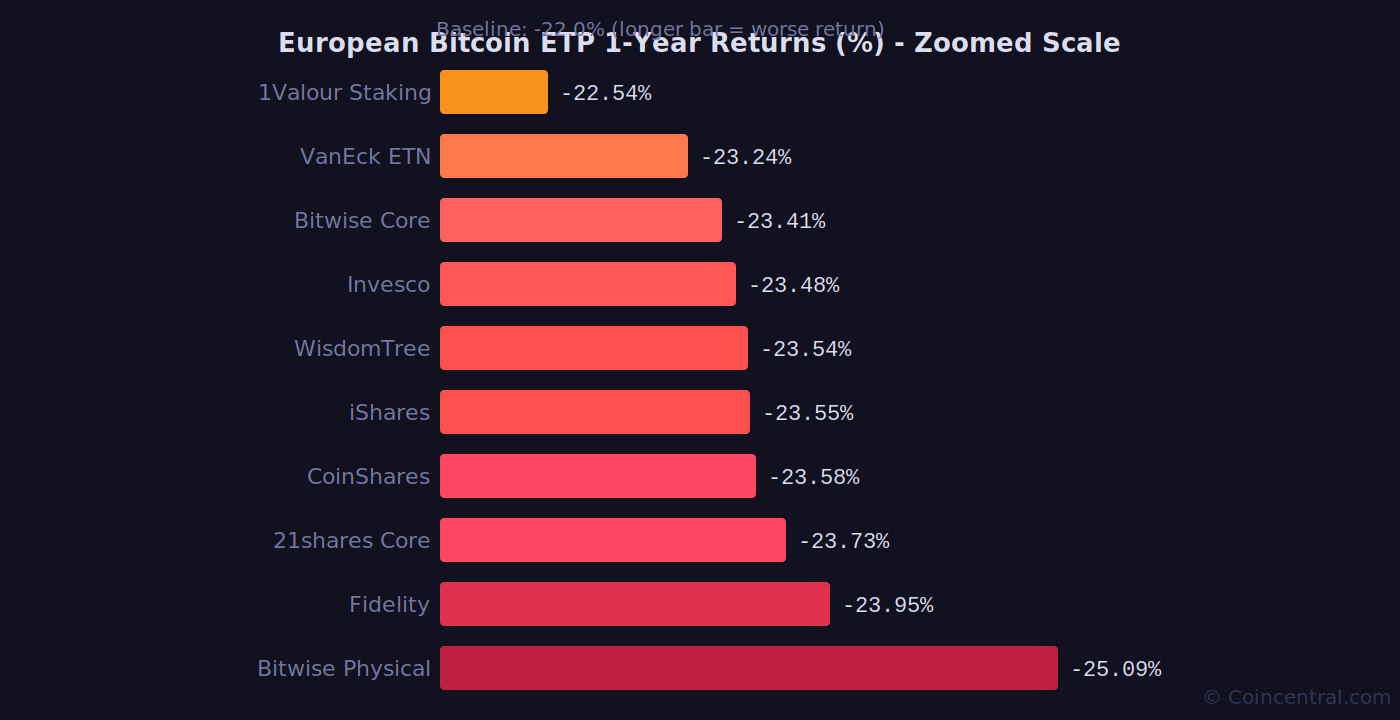
Chart 5: European Bitcoin ETP 1-year returns on a zoomed scale (baseline: -22%). Shorter bar = better return. Source: justETF.
The zoomed scale on this chart makes the performance differences visible. On a full scale, all bars would look nearly the same because the values cluster between -22.54% and -25.09%. The 2.55 percentage point gap between best and worst is meaningful over time, especially given that fees are the main driver of that spread.
Over three years, the results are much more positive. The 21shares Bitcoin Core ETP leads with +189.64%, followed by WisdomTree Physical Bitcoin at +188.71% and Invesco Physical Bitcoin at +188.55%. The worst three-year performer with available data is Bitwise Physical Bitcoin ETP at +173.87%, weighed down by its 2.00% annual fee compounding over the period.
IBIT vs FBTC vs GBTC: A Direct Comparison
Three funds dominate the US Bitcoin ETF market: BlackRock’s IBIT, Fidelity’s FBTC, and Grayscale’s GBTC. Together they hold about $94.9 billion in assets, or around 85% of the total across all US spot Bitcoin ETFs.
IBIT’s dominance is clear across every data point. It holds $68.67 billion in assets, compared to $15.66 billion for FBTC and $10.56 billion for GBTC. Its daily trading volume of $118 million on October 8 was more than 15 times that of either of its closest competitors.
The three funds tell three very different stories of investor behavior. IBIT has attracted $65.72 billion in cumulative net inflows. FBTC has attracted $10.73 billion. GBTC has suffered $27.94 billion in cumulative net outflows. The contrast captures the broader shift in where Bitcoin investors are putting their money.
| Metric | IBIT (BlackRock) | FBTC (Fidelity) | GBTC (Grayscale) |
|---|---|---|---|
| AUM | $68.67B | $15.66B | $10.56B |
| BTC Held | 785,640 | 176,510 | 126,580 |
| Annual Fee | 0.25% | 0.25% | 1.50% |
| YTD Return | -2.34% | -2.30% | -3.25% |
| Daily Volume (Oct 8) | $118M | $7.2M | $7.4M |
| Market Cap | $64.59B | $14.48B | $10.43B |
| Premium / Discount to NAV | +0.19% | +0.43% | -0.05% |
| Cumulative Net Flow (all time) | +$65.72B | +$10.73B | -$27.94B |
| Max Single-Day Inflow | +$1,119.9M | +$473.4M | +$102.5M |
| Max Single-Day Outflow | -$528.3M | -$356.6M | -$642.5M |
Table 8: IBIT, FBTC, and GBTC side-by-side comparison. Source: Farside Investors, SoSoValue, ETF Database.
GBTC is the only major fund trading at a discount to NAV (-0.05%). This means investors are paying slightly less than the value of the Bitcoin behind each share. FBTC shows the largest premium at +0.43%, which means investors are paying slightly more than NAV to hold shares. These premiums and discounts are small but worth tracking over time.
GBTC’s maximum single-day outflow of $642.5 million is higher than IBIT’s maximum outflow of $528.3 million, even though IBIT is more than six times larger by AUM. This reflects the intense selling pressure GBTC faced immediately after its ETF conversion, when investors who had been locked in for years finally gained the ability to exit.
Year-to-date, GBTC is down 3.25%, compared to -2.34% for IBIT and -2.30% for FBTC. The extra percentage point of underperformance is largely explained by GBTC’s 1.25 percentage point fee advantage that the other two funds have over it.
Key Findings
Bitcoin ETFs have attracted $57.79 billion in net inflows since their January 11, 2024 launch. Total assets across US funds now sit at $111.09 billion, with BlackRock’s IBIT holding over 60% of that total on its own.
Flows turned choppy in October 2026. After a strong September with $2.65 billion in monthly inflows, the market produced a $484.9 million outflow on October 7, the largest in more than three months. This placed October on track to be the first negative month since the July trough.
Fee competition has been intense. Most new spot ETFs priced below 0.25% at launch, putting steady pressure on GBTC’s 1.50% fee. GBTC has lost nearly $28 billion in cumulative net flows as investors moved to cheaper options.
In Europe, the Bitcoin ETP market is growing but remains small relative to the US. The top three products hold between 1.4 and 1.6 billion euros each. Fee structures in Europe are more varied, ranging from 0.05% to 2.00% per year.
Performance over 12 months has been negative across all products due to Bitcoin’s price decline from 2025 peaks. Over three years, most European ETPs show returns between 173% and 189%, reflecting Bitcoin’s long-term appreciation.


