






Bitcoin is the world’s largest cryptocurrency by market value. It is also one of the most energy-intensive computing networks on the planet.
The energy demand comes from Bitcoin’s mining process, called Proof of Work. Miners run powerful computers around the clock to validate transactions and earn newly created coins. That constant computation draws enormous amounts of electricity.
This article pulls together the latest data on Bitcoin’s energy footprint. It covers electricity use, carbon emissions, water consumption, electronic waste, and how Bitcoin compares to traditional payment systems and other industries.
Bitcoin’s Energy Use at a Glance
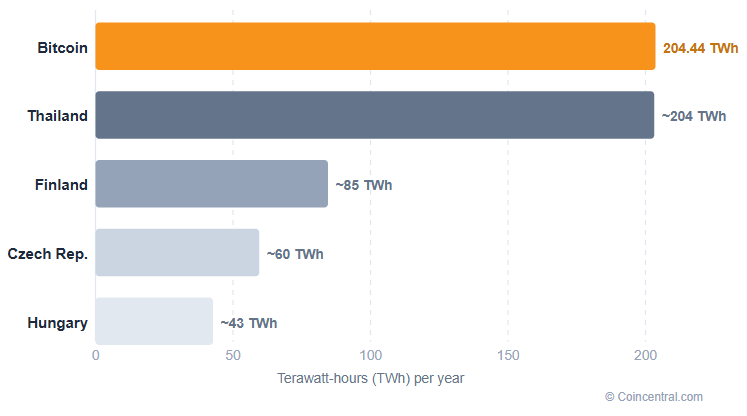
Bitcoin’s network consumes an estimated 204.44 terawatt-hours (TWh) of electricity every year. That is roughly equal to the annual power consumption of Thailand, a country of 72 million people.
To put that in context, Finland uses about 85 TWh per year. Hungary uses around 43 TWh annually. Bitcoin’s estimated consumption is more than double Finland’s and nearly five times Hungary’s, despite not powering homes, factories, or cities.
These estimates come from the Bitcoin Energy Consumption Index (BECI), which tracks the network’s energy use using an economic model. The index assumes that miner income and electricity costs move in step with each other. When miners earn more, they can afford to run more powerful machines, which drives up total consumption.
The model produces a range rather than a single figure. The lower bound estimate is 82.45 TWh, based on best-case hardware efficiency. The upper bound is 309.35 TWh, assuming older, less efficient hardware. The mid-range estimate of around 160 to 204 TWh is considered the most credible daily figure.

Bitcoin’s energy consumption first attracted wider public attention around 2017, when its price surged and mining activity expanded fast. At its peak in early 2022, the network’s energy use briefly exceeded that of Finland on some estimates. Since then, figures have fluctuated with Bitcoin’s price, confirming the direct link between the two.
Mining hardware efficiency currently stands at an estimated 17.01 joules per terahash (J/TH). The most efficient machines run at around 9.50 J/TH, while older hardware can reach 30 J/TH or more. The network’s total power demand is estimated at 18.35 gigawatts (GW).
| Metric | Lower Bound | Best-Guess Estimate | Upper Bound |
|---|---|---|---|
| Network Power Demand | 9.41 GW | 18.35 GW | 35.29 GW |
| Annualized Consumption | 82.45 TWh | 160.81–204.44 TWh | 309.35 TWh |
| Hardware Efficiency | 9.50 J/TH | 17.01 J/TH | 30.00 J/TH |
The energy demand tied to Bitcoin is not fixed. It moves with Bitcoin’s price. When prices rise, mining becomes more profitable, drawing in more miners and pushing up total consumption. When prices fall, less efficient miners shut down and energy use drops.
The Carbon Footprint of Bitcoin
Bitcoin’s total carbon footprint is estimated at 114.03 million tonnes of CO2 (Mt CO2) per year. That is roughly equal to the annual carbon footprint of the Czech Republic as a country.
A single Bitcoin transaction generates an estimated 465.63 kilograms of CO2. By comparison, a single Visa transaction produces about 0.45 grams of CO2. One Bitcoin transaction generates the same carbon as roughly 1,031,993 Visa transactions, or 77,605 hours of watching YouTube.
The carbon intensity of Bitcoin’s electricity mix has been rising. A 2022 study in the journal Joule found that the average carbon intensity increased from 478.27 grams of CO2 per kilowatt-hour (gCO2/kWh) in 2020 to 557.76 gCO2/kWh by August 2021.
This shift followed China’s crackdown on Bitcoin mining in spring 2021. Before the ban, Chinese miners used a meaningful share of hydroelectric power during wet seasons. After relocating to the U.S. and Kazakhstan, they switched to coal- and gas-based electricity, which pushed up the network’s overall carbon intensity.
The share of renewables in the Bitcoin network’s energy mix fell from 41.6% before the China ban to 25.1% shortly after. This is one of the clearest examples of how policy decisions in one country can quickly reshape the global environmental cost of mining.
| Carbon Metric | Figure | Comparable To |
|---|---|---|
| Annual Carbon Footprint | 114.03 Mt CO2 | Czech Republic total emissions |
| Per-Transaction Carbon | 465.63 kg CO2 | 1,031,993 Visa transactions |
| Carbon Intensity (2020 avg.) | 478.27 gCO2/kWh | Higher than EU average grid |
| Carbon Intensity (Aug 2021) | 557.76 gCO2/kWh | Close to coal-heavy grids |
| Renewables share (pre-China ban) | 41.6% | Included Chinese hydropower |
| Renewables share (post-China ban) | 25.1% | Mainly US and Kazakhstan gas/coal |
Bitcoin vs. Traditional Payment Systems
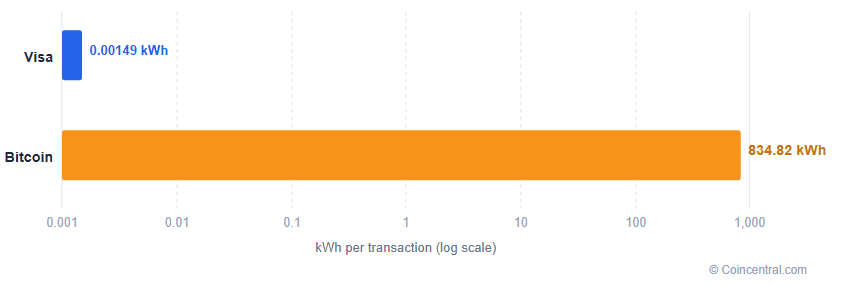
Bitcoin uses an estimated 834.82 kilowatt-hours (kWh) of electricity per transaction. That is enough to power an average U.S. household for 28.61 days.
Visa processed 138.3 billion transactions in 2019 using 740,000 gigajoules of energy for all its global operations. That works out to roughly 0.00149 kWh per Visa transaction. One Bitcoin transaction uses the equivalent energy of 561,675 Visa transactions.
The carbon gap is even wider. Bitcoin produces about 465.63 kg of CO2 per transaction, versus 0.45 grams for Visa. After accounting for Visa’s cleaner energy mix, one Bitcoin transaction has a carbon footprint equal to over 1 million Visa transactions.
This comparison is not straightforward. Bitcoin’s energy use is not set by how many transactions it processes. It is set by how profitable it is to mine. Even if no one used Bitcoin for payments, the miners would still consume roughly the same amount of electricity. The energy cost per transaction is high because the number of transactions is very low.
Bitcoin’s blockchain is capped at roughly 7 transactions per second, or about 220 million per year under ideal conditions. The global financial system handles more than 700 billion digital payments annually. Visa alone can handle over 65,000 transactions per second at peak capacity. Bitcoin’s total theoretical annual capacity represents just 0.03% of global digital payment volume.
Countries with modest payment systems process more volume than Bitcoin can handle. Hungary, for example, processes over 300 million electronic payments per year. Bitcoin would need its entire annual capacity just to serve Hungary, leaving nothing for the rest of the world.
| Metric | Bitcoin | Visa |
|---|---|---|
| Energy Per Transaction | 834.82 kWh | ~0.00149 kWh |
| Carbon Per Transaction | 465.63 kg CO2 | 0.00045 kg CO2 |
| Max Transactions Per Second | 7 | 65,000+ |
| Annual Transaction Capacity | ~220 million | 138.3 billion (2019 actual) |
| Share of Global Digital Payments | 0.03% (max) | Processes majority of card volume |
| Energy Ratio (per tx) | 1 Bitcoin tx = energy of 561,675 Visa tx | |
Not all Bitcoin mining runs on fossil fuels. Research by ESG analyst Daniel Batten found that over 52% of Bitcoin mining now uses renewable energy.
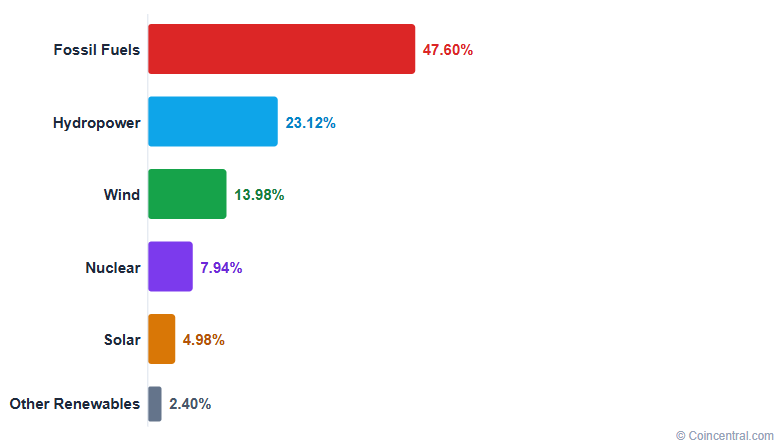
Hydropower is the single largest source, accounting for 23.12% of Bitcoin’s energy mix. Wind energy makes up 13.98%, nuclear and non-renewable sources account for 7.94%, solar provides 4.98%, and other renewable sources make up the remaining 2.40%. The combined renewable share comes to 52.40%.
The remaining roughly 47.6% comes from fossil fuels, primarily coal and natural gas in the U.S. and Kazakhstan. These two countries became the largest Bitcoin mining regions after China’s 2021 crackdown pushed miners out.
The renewable share dropped sharply after the China ban. Before the ban, Bitcoin’s renewable share was estimated at 41.6%, driven partly by access to cheap Chinese hydropower during the wet season. It fell to 25.1% immediately after, then recovered as miners adopted cleaner options over time.
A structural barrier limits how far renewables can go. Bitcoin miners need constant power, 24 hours a day, 365 days a year. Renewable energy sources like wind and solar are intermittent. They do not always generate power when demand exists.
When renewable output drops, miners draw from whatever backup power is available. In most regions, that backup is fossil fuel. A peer-reviewed paper in the journal Joule titled “Renewable Energy Will Not Solve Bitcoin’s Sustainability Problem” argues that this mismatch makes Bitcoin and renewables a poor fit at scale. Renewables reduce baseload fossil fuel use, but Bitcoin miners increase baseload demand and cannot pause during low-generation periods.
| Energy Source | Share of Bitcoin Mining | Category |
|---|---|---|
| Fossil Fuels (coal, gas) | ~47.60% | Non-renewable |
| Hydropower | 23.12% | Renewable |
| Wind | 13.98% | Renewable |
| Nuclear / Non-renewable | 7.94% | Low-carbon (debated) |
| Solar | 4.98% | Renewable |
| Other Renewables | 2.40% | Renewable |
| Total Renewables | 52.40% | Combined |
Electronic Waste and Water Consumption
Bitcoin’s environmental impact goes beyond electricity and carbon. Mining generates large amounts of electronic waste (e-waste) and uses freshwater for equipment cooling.
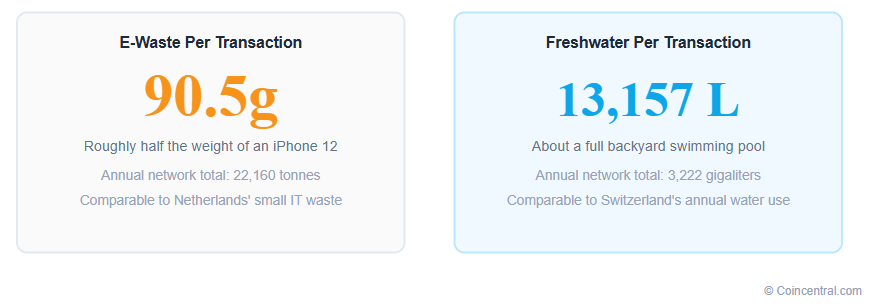
The Bitcoin network produces an estimated 22.16 kilotonnes (kt) of electronic waste per year. That is comparable to the volume of small IT equipment waste generated annually by the Netherlands.
A single Bitcoin transaction generates approximately 90.50 grams of e-waste. That is roughly the weight of half an iPhone 12. Bitcoin mining hardware has a short useful life because newer, more efficient machines continually replace older models.
Once mining hardware becomes unprofitable to run, it is typically discarded. Unlike consumer electronics, old mining rigs often have no secondary market or practical reuse case, as they are highly specialized devices built for a single purpose.
Bitcoin mining also uses freshwater for cooling. The network’s estimated annual freshwater consumption is 3,222 gigaliters (GL), comparable to Switzerland’s total annual water use. A single Bitcoin transaction uses an estimated 13,157 liters of water, roughly the amount in a backyard swimming pool.
| Resource | Annual Total | Per Transaction | Comparable To |
|---|---|---|---|
| Electronic Waste | 22.16 kt/year | 90.50 grams | Netherlands’ small IT waste |
| Fresh Water | 3,222 GL/year | 13,157 liters | Switzerland’s annual water use |
Bitcoin Mining vs. Gold Mining
Bitcoin is often called “digital gold” because both assets have a fixed maximum supply and require sustained effort to produce. The comparison also extends to environmental cost, and Bitcoin does not come out well.
Around 3,531 tonnes of physical gold are mined globally each year. Total CO2 emissions from the gold mining industry run to approximately 81 million metric tonnes per year.
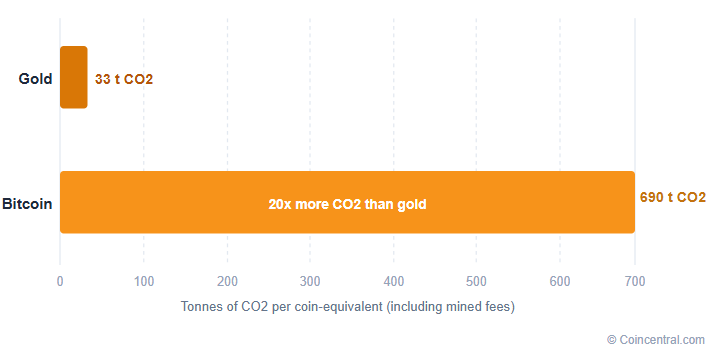
Mining one Bitcoin’s worth of gold produces roughly 33 tonnes of CO2. Mining one Bitcoin through the Bitcoin network produces an estimated 690 tonnes of CO2, including transaction fees. Bitcoin’s per-coin carbon cost is more than 20 times higher than the gold equivalent.
The comparison has important limits. Physical gold, once mined, holds its value indefinitely without anyone maintaining it. Bitcoin mining must continue non-stop for the network to function at all. If miners stopped, the Bitcoin network would cease to operate, and existing coins could not be transferred.
That creates a permanent, ongoing energy commitment with no off switch. Gold mining could theoretically stop tomorrow and existing reserves would remain intact. Bitcoin mining has no equivalent safety net.
| Metric | Gold Mining | Bitcoin Mining |
|---|---|---|
| Annual Volume | 3,531 tonnes/year | ~900 BTC mined/day |
| Total Annual Industry CO2 | ~81 million metric tonnes | ~114 Mt CO2 |
| CO2 Per Bitcoin-Equivalent | 33 tonnes | 690 tonnes |
| Can production stop? | Yes, reserves intact | No, network would cease |
| CO2 Ratio (Bitcoin vs Gold) | Bitcoin produces 20x more CO2 per coin-equivalent | |
Miner Economics and Energy Costs
Mining is a business driven by profit margins. The energy consumed by the Bitcoin network is directly tied to how profitable it is to mine at any given moment.
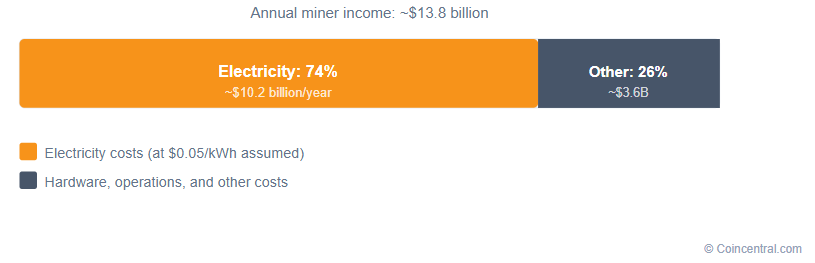
The Bitcoin Energy Consumption Index estimates annual miner income at approximately $13.8 billion. This includes both newly created Bitcoin and transaction fees. Electricity costs account for an estimated $10.2 billion of that, or roughly 74% of total income. These figures assume an average electricity rate of $0.05 per kilowatt-hour.
When Bitcoin’s price rises, mining revenue increases. Miners invest in more machines and draw more power. When the price falls, the least efficient miners shut off their hardware, and total network energy use drops. This creates a direct feedback loop between Bitcoin’s market price and its environmental footprint.
Bitcoin also has a built-in supply limit of 21 million coins. More than 90% have already been mined. As the limit approaches over decades, mining difficulty increases, meaning more computation is required per coin. This built-in scarcity mechanism ensures that mining will always be energy-intensive as long as Bitcoin has value.
The 5 cents per kWh assumption is conservative. Many large mining operations negotiate lower rates, sometimes as low as 2 to 3 cents, which would make mining even more profitable and could sustain higher energy consumption than the index estimates.
| Economic Metric | Figure |
|---|---|
| Annualized Miner Income | ~$13.8 billion |
| Annualized Electricity Costs | ~$10.2 billion |
| Electricity as % of Income | 74.06% |
| Assumed Electricity Rate | $0.05 per kWh |
| Bitcoin Already Mined | Over 90% of 21 million cap |
What Could Change?
Bitcoin’s Proof of Work system is written into its software at a fundamental level. Unlike Ethereum, which switched from Proof of Work to Proof of Stake in 2022, Bitcoin has no realistic path to a similar change.
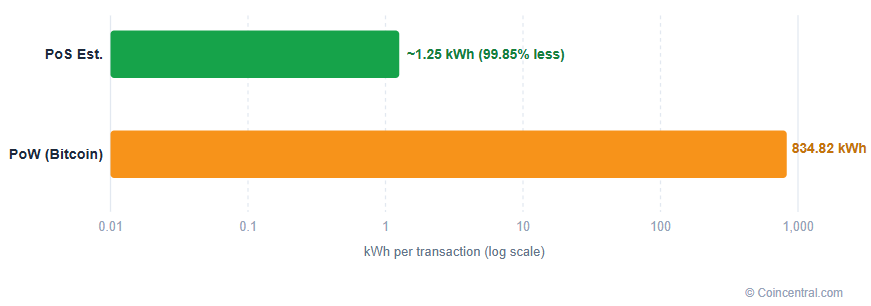
Proof of Stake uses far less energy than Proof of Work. In a Proof of Stake system, validators create new blocks based on how much cryptocurrency they hold, rather than by racing to solve computational puzzles. Switching to Proof of Stake is estimated to cut energy use by at least 99.85%. A single transaction would drop from 834.82 kWh to roughly 1.25 kWh or less.
However, Proof of Work is part of what gives Bitcoin its specific properties. Mining creates scarcity and security that many users and investors see as central to Bitcoin’s value. Changing the consensus mechanism would alter the network’s risk profile in ways that most Bitcoin developers and stakeholders strongly oppose.
Some argue that the Lightning Network, a second-layer payment system built on top of Bitcoin, could reduce the per-transaction energy cost by processing many payments off-chain. But moving any funds into the Lightning Network still requires a transaction on the main Bitcoin blockchain. If every person alive today needed just one such transaction, it would take Bitcoin’s main chain 35 years to process them all.
Carbon offsetting offers a partial answer. Planting trees, purchasing carbon credits, or investing in carbon capture can compensate for some emissions. The crypto industry has started exploring tokenized carbon credits as one approach. But there is no reliable data on how much Bitcoin mining is currently being offset.
The most practical trend has been to locate mines near cheap renewable energy sources. Operations in Iceland use geothermal power. Some facilities in the Pacific Northwest and parts of South America access surplus hydroelectric generation. These moves reduce carbon intensity without changing Bitcoin’s underlying design, but they do not remove the structural demand for constant power.
Conclusion
Bitcoin’s energy footprint is large, well-documented, and closely tied to the price of the currency. The network uses over 200 TWh of electricity per year, produces more than 114 million tonnes of CO2, generates tens of thousands of tonnes of e-waste, and consumes billions of liters of water.
Its per-transaction energy and carbon costs are hundreds of thousands of times higher than those of traditional payment systems. This gap exists not because Bitcoin is wasteful by accident, but because its design prioritizes security and decentralization over efficiency. The energy cost is a deliberate product of Proof of Work.
Over half of Bitcoin mining now runs on renewable energy, and that share is growing. But structural limits on renewable power availability mean a full transition to clean energy is unlikely under the current setup. Some fossil fuel backup will almost always be needed to maintain constant mining output.
Whether Bitcoin’s environmental cost is justified depends on your view of its other qualities: decentralization, censorship resistance, and fixed supply. The data above gives a factual picture of what that cost currently looks like in numbers.
Sources
- Digiconomist: Bitcoin Energy Consumption Index (BECI)
- Cambridge Centre for Alternative Finance: Cambridge Bitcoin Electricity Consumption Index (CBECI)
- de Vries, A. & Stoll, C. (2022). “Bitcoin’s Growing e-Waste Problem.” Joule.
- de Vries, A. et al. (2022). “Revisiting Bitcoin’s carbon footprint.” Joule.
- de Vries, A. (2021). “Renewable Energy Will Not Solve Bitcoin’s Sustainability Problem.” Joule.
- Stoll, C. et al. (2019). “The Carbon Footprint of Bitcoin.” Joule.
- Statista: Bitcoin energy consumption worldwide, 2017–2025 (K. Scholle, Dec 2025)
- Visa Inc.: ESG Report — energy and transaction data
- Daniel Batten: Bitcoin Mining Sustainable Energy Research (ESG)
- Crypto.com: How Much Energy Does Bitcoin Consume?


