



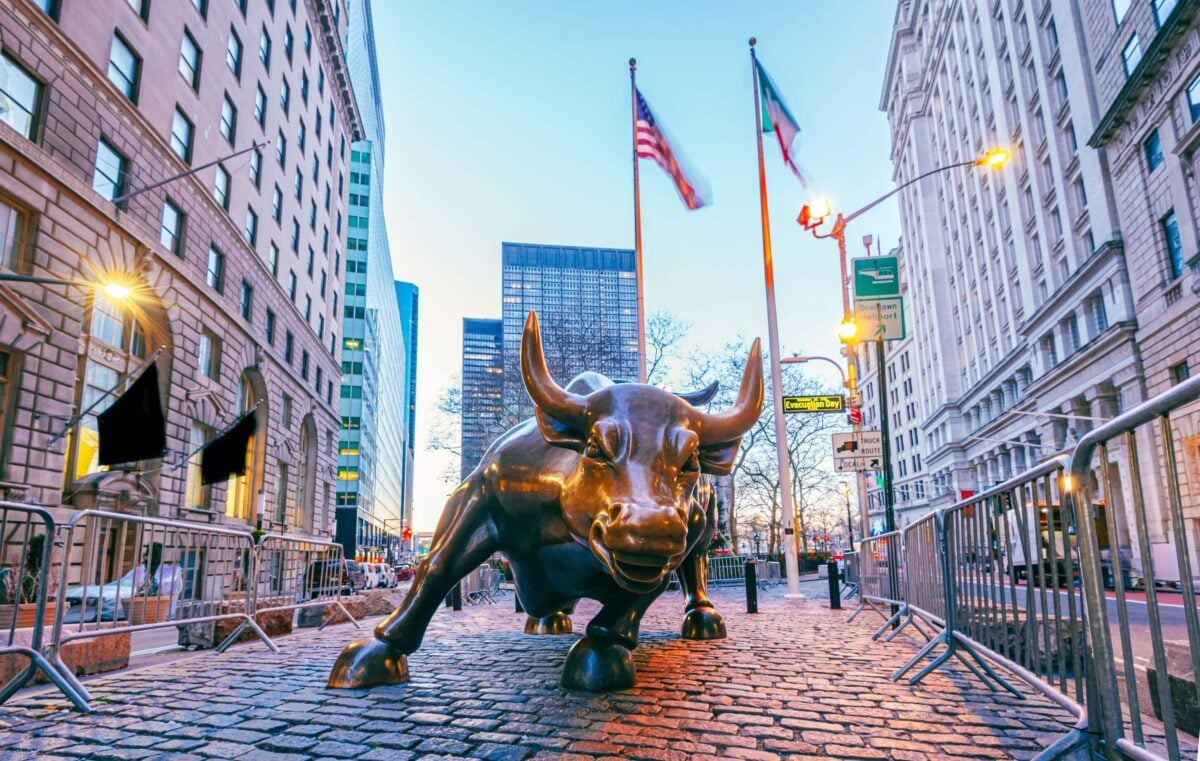


The US stock market reached a milestone on October 12, 2026. The S&P 500 bull market turned four years old, counting from the closing low of October 12, 2022.
This article uses reporting from Reuters, Inc., Seeking Alpha, MarketWatch, CoinDesk and others to compare the current run with past cycles. It covers returns, length, concentration, breadth and the risks that analysts are watching.
Figures differ between sources because some measure price return and others measure total return. Dates also vary slightly. Where it matters, the article says so.
The Bull Market at Four Years: Headline Numbers
The S&P 500 is trading near record highs and has more than doubled since its closing low on October 12, 2022. Reuters reports the gain at 117%. Inc. puts it at 118%, and Seeking Alpha, citing Roth Capital Partners data through October 8, shows 117.1%.
MarketWatch reports a higher number: 131%. That is a cumulative total return, which includes dividends. It works out to 23.3% a year, which MarketWatch says is nearly triple the market’s historical average.

The figures differ because of the measure used and the date chosen. Price return counts only the change in the index, while total return adds dividends. All of the sources agree on the main point, which is that the index has more than doubled.

A common definition of a bull market is a gain of at least 20% that follows a decline of at least 20% from a peak. Reuters notes that experts differ on the exact definition. The current run began about a month before ChatGPT launched.
The index sits within 1% of its 52-week high, according to Inc. It has also climbed just over 17% since its third birthday a year ago.
Four-year returns are measured from the low of a bear market. Reuters notes that the 2022 low came during a sharp rate-hiking cycle. Starting from a low point raises the size of the reported gain.
| Measure | Figure | Source |
|---|---|---|
| Gain since October 2022 | 117% | Reuters |
| Gain since October 2022 | 118% | Inc. |
| Cumulative return through early October | 117.1% | Seeking Alpha / Roth Capital |
| Cumulative total return | 131% | MarketWatch |
| Annualized total return | 23.3% | MarketWatch |
| Gain in the past 12 months | Just over 17% | Inc. |
How the Rally Compares With Past Bull Markets
Ryan Detrick, chief market strategist at Carson Group, ranks the current gain as the third-best start for a bull market at its fourth birthday. Seven other bull markets have reached that age in the last seven decades. Only two began with a bigger gain.
Reuters, also citing Detrick, says this is the eighth-longest bull market since World War II. It is also the sixth-best performer in that period at 117%. Reuters describes the run as middle-aged.

Full-cycle numbers give more context. Inc. reports that bull markets have delivered an average gain of 192% since 1950. The 1987 to 2000 run gained 582%, and the 2009 to 2020 run gained 401%.
Those are totals for completed cycles. The current rally is still going, so its final number is not known yet.
Seeking Alpha looked at longer cycles only. Their median cumulative gain was 177.2%, and the average was 253.3%. Those figures include the full length of each run, not just the first four years.
Inc. points out that the 1987 to 2000 and 2009 to 2020 runs were much longer than four years. That is why their totals are so large. The comparison is between a four-year gain and full-length cycles.
| Bull market | Gain |
|---|---|
| Current run (to date) | About 118% |
| Median of longer cycles (full cycle) | 177.2% |
| Average since 1950 (full cycle) | 192% |
| Average of longer cycles (full cycle) | 253.3% |
| 2009 to 2020 | 401% |
| 1987 to 2000 | 582% |
What Happened in the Fifth Year of Earlier Bull Markets
Seeking Alpha counted six earlier S&P 500 bull markets that lasted at least four years. Five of them kept rising in year five. The average fifth-year return was 13.5%, with gains from 6.8% to 36.6%.
The one exception began in October 1957. It fell 19.2% in its fifth year before ending. Inc. counts seven earlier bull markets that reached a fourth birthday, so the totals vary by data set.

Among the longer cycles, the median length was 5.7 years and the average was 7.3 years. The median return through year four was 72.2%, and the average was 89.1%. The current 117.1% is above both.
Detrick said the last time a bull market passed its third birthday and did not reach its fifth was in the early 1960s. Over the past 50 years, he said, bulls that got this far made it to at least a fifth birthday. The average final length was eight years.
Roth Capital Partners, the source of the data, adds a caution. Outcomes have varied, and past patterns do not guarantee future results.
The 1957 exception is a reminder that early patterns do not decide the outcome. Five of the six longer cycles rose in year five, a record of 83%. The sample is small, so analysts treat it as a guide rather than a rule.
| Metric | Earlier longer cycles | Current run |
|---|---|---|
| Median return through year four | 72.2% | 117.1% |
| Average return through year four | 89.1% | 117.1% |
| Median length | 5.7 years | 4 years so far |
| Average length | 7.3 years | 4 years so far |
| Average fifth-year return | 13.5% | Not yet known |
| Range of fifth-year returns | -19.2% to 36.6% | Not yet known |
Does Age End a Bull Market?
Ned Davis Research tracks 38 bull markets since 1900. Of those, 33 were shorter than the current one. The average length is 25 months, and the median is 22 months.
Those numbers lead some investors to worry that the rally is old. Mark Hulbert of MarketWatch calls that a statistical sleight of hand. He compares it to arguing that day causes night because night follows day.

Mark Hackett, chief market strategist at Nationwide, made a similar point to Reuters. He said bull markets do not end of old age, but from disease. He added that four years is not scary for a bull market.
What does end them? Hulbert lists recessions, investor exuberance and outside shocks such as wars or pandemics. Thirteen of the 22 bear markets since 1950 came with a recession.
Some investors count the current bull market from the March 2009 low, which would make it 17.5 years old. Hulbert says the theory holds that later bear markets did not count. Even so, other 17.5-year periods in US history produced better returns.
The age question also depends on how a bull market is defined. Reuters notes that experts differ on the definition. A different start date or threshold changes the number of cycles and their lengths.
| Measure | Length in months |
|---|---|
| Median of 38 bull markets since 1900 | 22 |
| Average of 38 bull markets since 1900 | 25 |
| Current bull market | 48 |
Has the Market Risen Too Far in Four Years?
A second worry is size rather than age. Some investors fear that a market that rises too far is prone to a fall. The 131% four-year total return, equal to 23.3% a year, is the figure behind that concern.
Edward McQuarrie, an emeritus professor at Santa Clara University, and William Bernstein, founder of EfficientFrontier.com, tested this idea. They measured the market’s trailing four-year total return for each month since the late 1700s. They found many cases where the return was higher than it is now.

In their words, it happens all the time. They wrote, “No biggie. Not even close.” They reached the same conclusion for the 17.5-year period since 2009.
The pace has also cooled. The index gained just over 17% in the past year, according to Inc. That is below the 23.3% average annual total return of the full run.
Inc. also reports that forward valuations have fallen. That has made many popular AI stocks cheaper than they were a year ago. Reuters says S&P 500 earnings are expected to rise more than 35% this year.
Hulbert’s point is that the size of a gain says little about what comes next. The four-year pace is high compared with the market’s average, but not compared with all of history. The data set covers monthly readings going back to the late 1700s.
| Measure | Figure |
|---|---|
| Four-year cumulative total return | 131% |
| Annualized total return | 23.3% |
| Gain in the past 12 months | Just over 17% |
| Expected 2026 S&P 500 earnings growth | More than 35% |
Market Concentration: A Few Companies Carry More Weight
The rally has been led by a small group of large companies. J.P. Morgan Asset Management says the top 10 stocks now make up about 40% of the S&P 500. In October 2022 that figure was about 28%.
Apple, Microsoft and Nvidia together account for about 22% of the index’s market value. That is up from about 14% in late 2022. The group once known as the Magnificent Seven drove most of the gains, and the market now appears to be narrowing further.

Reuters reports that only two of the 11 S&P 500 sectors have beaten the index: technology and communication services. The second group includes Alphabet and Meta Platforms. Thirteen US companies now have market values of at least $1 trillion, and all but two are in tech or have large AI exposure.
Angelo Kourkafas, senior global investment strategist at Edward Jones, said concentration reflects strong earnings. He also said it adds risk. If the leading theme falls out of favor, portfolios could feel it more than usual.
Other chipmakers and memory stocks have also posted strong gains. That puts even more attention on a short list of companies.
A bigger weight means a bigger effect on the index when those stocks move. That works in both directions. The index has benefited from the gains of its largest members, and it would also feel their losses more.
| Measure | October 2022 | Now |
|---|---|---|
| Top 10 weight in the S&P 500 | About 28% | About 40% |
| Apple, Microsoft and Nvidia combined | About 14% | About 22% |
| US companies worth $1 trillion or more | Not given | 13 |
| Sectors that beat the index | Not given | 2 of 11 |
Market Breadth: Few Stocks Drive the Gains
The Kobeissi Letter, a market research newsletter, looked at who has produced the index’s gains. Since the start of 2024, a basket of 42 AI stocks has generated 67% of the S&P 500’s price return. That is 22 percentage points of the index’s 33% gain.
The other 458 stocks added 11 percentage points. In the same analysis, 84% of S&P 500 companies trade at least 10% below their all-time highs. That puts most stocks in the index in correction territory while the index itself sits at a record.

Ned Davis Research says market breadth is at an all-time low for a moment when the index is at a record. Breadth measures the share of stocks that are rising versus falling. The firm says that once breadth drifts away from index performance, the S&P 500 has historically peaked within months.
Morgan Stanley links the weak breadth to rates. Breadth worsened after the Fed’s hawkish Jackson Hole symposium, when rate expectations rose. Chief Investment Officer Mike Wilson wrote that if bond volatility fades soon, breadth is likely to catch up with the index.
Wilson also said the key question is whether bond stress spills into equity volatility. So far that volatility has stayed calm.
Breadth and concentration are linked. When a few stocks do most of the work, the average stock can fall behind the index. That is the pattern the 84% figure describes.
| Group | Contribution since start of 2024 |
|---|---|
| 42 AI stocks | +22 percentage points |
| Other 458 stocks | +11 percentage points |
| S&P 500 total price gain | +33% |
| S&P 500 stocks 10% or more below highs | 84% |
Earnings, AI Spending and Company Gains
Reuters calls AI spending the engine behind the rally. S&P 500 earnings are expected to rise more than 35% this year, helped by data center spending from large cloud companies. Oxford Economics estimates that about one-third of recent US economic growth comes from AI.
That estimate includes direct investment in AI infrastructure. It also includes some effect from stock gains that lift consumer spending.

Nvidia shows the scale of the change. Its market value rose to $5.8 trillion from $286 billion on October 12, 2022, making it the world’s largest company. CoinDesk reports that its shares have risen about 1,875%, while Meta is up about 488%.
Samsung expects third-quarter operating profit of about $80 billion. If it reaches that number, it would be the highest quarterly profit ever for a tech company. CoinDesk also cites FactSet data showing a record number of S&P 500 companies issued positive third-quarter guidance.
Not everyone sees easy gains ahead. Anthony Saglimbene of Ameriprise said the easy money around AI has been made. He expects more pressure on tech companies to show that spending will turn into profit.
HSBC takes the other side. Its team says cuts to free cash flow forecasts for large cloud providers have begun to slow, with improvement expected by 2027.
Hackett of Nationwide said earnings and AI investment remain powerful supports for growth stocks. He also said high long-term rates, energy-driven inflation risk and narrow breadth leave less room for disappointment.
| Item | Figure |
|---|---|
| Nvidia market value, October 12, 2022 | $286 billion |
| Nvidia market value, October 2026 | $5.8 trillion |
| Nvidia share price gain | About 1,875% |
| Meta share price gain | About 488% |
| Samsung expected Q3 operating profit | About $80 billion |
| Share of US growth tied to AI (Oxford Economics) | About one-third |
Interest Rates, Recessions and Other Risks
Reuters lists the Fed’s turn to rate hikes and rising Treasury yields as the main obstacles. The 10-year Treasury yield is around 5.2% after reaching its highest level in 24 years. Higher yields can pull money toward bonds and away from stocks.
The last bear market, which ended with the October 2022 low, came during a sharp rate-hiking cycle. Reuters adds that markets could be volatile ahead of next month’s US midterm elections. Hackett also pointed to war and energy-driven inflation risk.

Edward Jones remains overweight stocks, but less so than before. Kourkafas said the firm still believes the bull market is not about to end, but it makes sense to take some risk off the table.
Recessions remain the most common companion of bear markets. Thirteen of the 22 bear markets since 1950 came with one, which leaves nine without a recession.
HSBC says weak US data could pull the Treasury yield curve lower and support valuations. After 2027, a Goldilocks mix of solid growth, falling inflation and lower rates could help tech and earnings again. HSBC adds that any such rally may still be concentrated.
Morgan Stanley and HSBC both tie the next move to bonds. In Wilson’s view, falling yields would help breadth catch up with the index. HSBC sees a similar path if US data keeps coming in weak.
The facts point to a long and strong rally with narrow support. Whether breadth improves will depend largely on rates.
| Risk | Data point |
|---|---|
| 10-year Treasury yield | About 5.2% |
| Yield trend | 24-year high reached recently |
| Bear markets with a recession since 1950 | 13 of 22 |
| Events ahead | US midterm elections next month |
| Concentration | Top 10 stocks about 40% of index |
Sources
- There’s a tough truth under the surface of the 4-year-old bull market in stocks (Max Adams)
- The S&P 500’s Bull Market Just Turned 4. History Says the Next Year Is What Matters Most (Inc., Phil Rosen)
- The bull market celebrates its four-year birthday as markets continue to rise (Seeking Alpha, Jason Capul)
- AI-centered US stock bull market nears four-year anniversary (Reuters, Lewis Krauskopf)
- Investors worry the bull market is getting old. But history shows it can continue to age gracefully. (MarketWatch, Mark Hulbert)
- U.S. stock bull market rises 131% over four years as structural risks emerge (CoinDesk via 币界网)


