



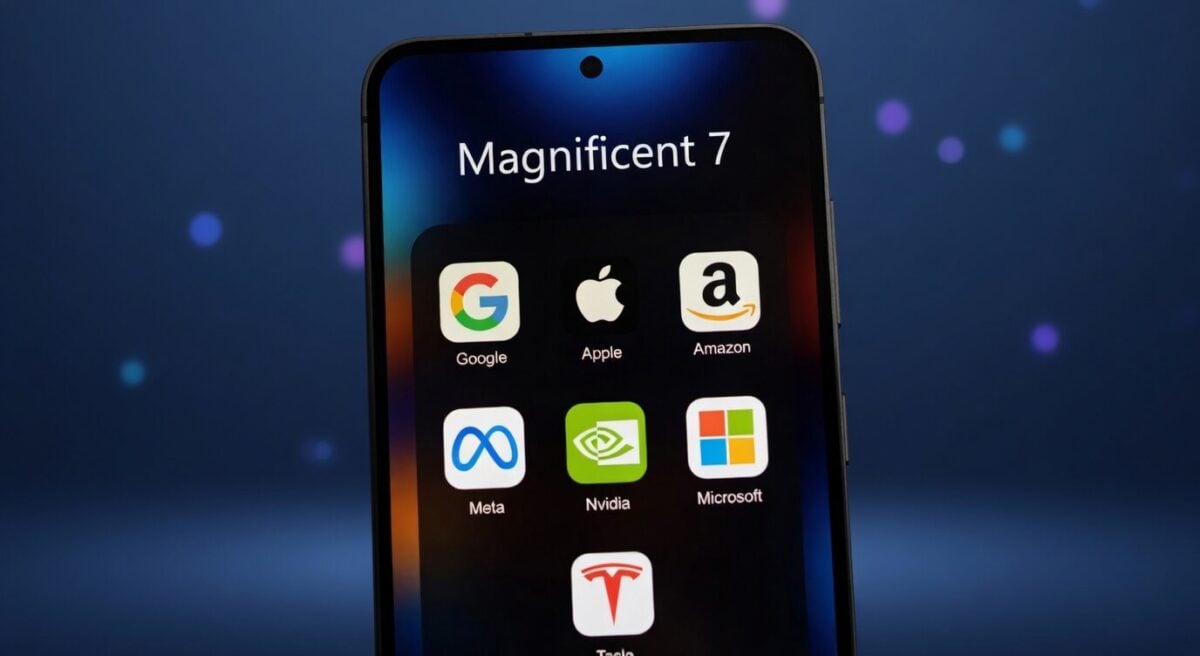

The Magnificent 7 are seven large U.S. companies that now make up more than one-third of the S&P 500. Their combined market value is close to $25 trillion.
This article uses data from Fidelity, MarketWatch, The Motley Fool, Seeking Alpha, Investopedia and MacroMicro. It covers size, index weight, returns, spending and investor demand. Figures come from different dates, and the dates are noted throughout.
Past performance does not guarantee future returns. Nothing here is investment advice.
Who Are the Magnificent 7 Stocks?
The group includes Alphabet, Amazon, Apple, Meta Platforms, Microsoft, Nvidia and Tesla. Bank of America analyst Michael Hartnett coined the name in 2023. It comes from a 1960 Western film of the same name.
All seven have reached a market value of about $1 trillion or more. Fidelity reports that three of them passed $4 trillion as of January 2026. By October 2026, each company was worth more than $1 trillion.
Nvidia was the largest at $5.5 trillion on Oct. 13, 2026. Apple followed at $5.0 trillion, and Alphabet came next at $4.3 trillion. Tesla was the smallest at $1.5 trillion.
| Company | Ticker | Price | Market cap | Sector |
|---|---|---|---|---|
| Nvidia | NVDA | $225.55 | $5.5 trillion | Information Technology |
| Apple | AAPL | $346.33 | $5.0 trillion | Information Technology |
| Alphabet | GOOG | $349.55 | $4.3 trillion | Communication Services |
| Microsoft | MSFT | $549.26 | $4.0 trillion | Information Technology |
| Amazon | AMZN | $261.42 | $2.8 trillion | Consumer Discretionary |
| Meta Platforms | META | $770.48 | $1.9 trillion | Communication Services |
| Tesla | TSLA | $374.34 | $1.5 trillion | Consumer Discretionary |
The companies sit in different sectors. Apple, Microsoft and Nvidia are tied to information technology. Alphabet and Meta are in communication services, while Amazon and Tesla are in consumer discretionary.

Investopedia says the group spans four sectors, from software and chips to online retail and motor vehicles. Apple was the first to go public, in 1980. Nvidia listed in 1999.
Fidelity gives a short profile of each company. Alphabet is the parent of Google and also owns YouTube, Waze and Fitbit. Amazon runs online retail, the AWS cloud platform, Prime and Whole Foods.
Apple makes computers, phones, smartwatches and tablets, and runs Apple Music. Meta owns Facebook, Instagram and WhatsApp. Microsoft owns LinkedIn, and Tesla also makes solar roofs and home energy products.
Alphabet trades under two tickers. GOOGL shares carry voting rights, while GOOG shares do not. Fidelity says there is little difference beyond that.

Combined Value Compared With Whole Economies
MarketWatch put the group’s combined market value at nearly $25 trillion in a story published Oct. 7, 2026. It compared that figure with 2026 nominal GDP estimates from the International Monetary Fund.
On that basis, the group would rank second in the world if it were a country. It would sit ahead of China, Germany, Japan and the U.K. Only the U.S. economy, at $32.38 trillion, is larger.
| Economy | Value | Magnificent 7 compared |
|---|---|---|
| United States | $32.38 trillion | Group is 77% as large |
| Magnificent 7 | $24.95 trillion | Not applicable |
| European Union | $23.03 trillion | Group is 8% larger |
| China | $20.85 trillion | Group is 20% larger |
| Germany | $5.45 trillion | Group is 4.6 times larger |
| Japan | $4.38 trillion | Group is 5.7 times larger |
| United Kingdom | $4.26 trillion | Group is 5.9 times larger |
The two measures are not the same. Market cap is the value investors place on future profits. GDP counts the goods and services an economy makes in one year.
Even so, the comparison shows the scale of the group. Mike Treacy, head market analyst at Apex Fintech Solutions, said these companies operate “in herds.” That means their choices on spending and hiring can reach well beyond Wall Street.
He pointed to 2022 as an example. Rising interest rates ended the era of cheap capital, and many tech firms shifted to profit and cost-cutting.
The European Union is a bloc of member states rather than one country. It is shown here for reference.
MarketWatch says the group is closing in on the size of the U.S. At $24.95 trillion, it equals about 77% of U.S. GDP.
Investopedia makes a similar point about stock markets. It says the group is worth more than the market capitalization of exchanges in Toronto, Frankfurt, Tokyo and Shanghai.

Share of the S&P 500 Today
The group made up 34.9% of the S&P 500 in October 2026, according to The Motley Fool, which used Stock Analysis data. Over most of the past year, the share ranged from 32% to 35%.
MacroMicro, using Nasdaq data, reported 35.56% for September 2026. Small gaps between sources come from different dates and methods.
| Company | Weight in S&P 500 | Market cap |
|---|---|---|
| Nvidia | 8.0% | $5.5 trillion |
| Apple | 6.9% | $5.0 trillion |
| Alphabet | 6.0% | $4.3 trillion |
| Microsoft | 5.5% | $4.0 trillion |
| Amazon | 3.8% | $2.8 trillion |
| Meta Platforms | 2.6% | $1.9 trillion |
| Tesla | 2.1% | $1.5 trillion |
Nvidia has the largest weight at 8.0%. Apple is next at 6.9%, then Alphabet at 6.0%. Tesla has the smallest at 2.1%.
The Motley Fool says the group’s weight depends on how it performs. When the stocks trail the market, as they did at times in 2026, the index rebalances. Anyone who owns an S&P 500 index fund already holds these companies in these proportions.
Nvidia’s 8.0% weight is larger than Meta and Tesla combined, which total 4.7%. Apple and Nvidia together hold 14.9%, which is about 43% of the group’s total weight.
The seven stocks hold 34.9% of the index. That leaves 65.1% for every other company in the S&P 500.
MacroMicro lists the group’s market cap at $24.30 trillion in its latest reading and $23.55 trillion in the one before. The share of the S&P 500 in those two readings was 35.56% and 34.35%.
Investors in S&P 500 index funds sometimes worry about how top-heavy the index has become. The Motley Fool calls this a logical concern, since seven stocks hold more than one-third of the value.
The Motley Fool also notes that anyone in the index has shared in the group’s gains, especially in years when it drove most of the returns.

How the Group’s Share Has Grown Over Time
MacroMicro traces the rise of big tech back to the 1990s. Microsoft passed General Electric in 1998 to become the most valuable U.S. company. Apple passed ExxonMobil in 2012 and held the top spot for six years in a row.
In 2015, Facebook and Amazon joined the top 10 companies, and the group’s share of the S&P 500 passed 10%. Apple and Amazon each topped $1 trillion in 2018.
The pandemic sped up digital change in 2020. Tesla’s market value rose sevenfold, and the group’s share went above 25%. In 2021, Nvidia passed Berkshire Hathaway, and the group’s combined value topped $10 trillion.
| Period | What happened | Share of S&P 500 |
|---|---|---|
| 2015 | Facebook and Amazon join the top 10 | More than 10% |
| 2020 | Pandemic speeds digital shift | More than 25% |
| 2023 to 2024 | Generative AI lifts the group | More than 30% |
| End of 2024 | Fidelity estimate | About one-third |
| October 2026 | The Motley Fool estimate | 34.9% |
The market fell in 2022 because of the Russia-Ukraine war, higher inflation and rate hikes. Then generative AI, spurred by ChatGPT, pushed the group to new highs in 2023 and 2024.
Fidelity says the group held about one-third of the index in 2025. It also produced more than 40% of the S&P 500’s total return that year.
The mix inside the group has changed too. Nvidia was less than 1% of the group’s market cap in 2015. It now makes up 23%, according to The Motley Fool.
Grouping hot stocks is not new. Fidelity notes that the Nifty 50, a set of 50 blue-chip stocks, was popular in the 1960s and 1970s.
MacroMicro also records that Google entered the top 10 U.S. companies by market value in 2007. Tesla reached full-year profitability for the first time in 2020.

2026 Performance Against the S&P 500
The Motley Fool tracked returns through Sept. 4, 2026. The group returned 14.06% for the year to date, compared with 12.81% for the S&P 500. That is a lead of 1.25 percentage points.
Over one year, the group gained 18.07% against 15.00% for the index. The lead was 3.07 points.
| Company or index | Year to date | 1-year return |
|---|---|---|
| Apple | 22.74% | 29.33% |
| Alphabet | 9.74% | 40.00% |
| Amazon | 8.97% | 14.58% |
| Meta Platforms | 10.30% | 2.47% |
| Microsoft | 7.01% | 0.03% |
| Nvidia | 25.44% | 24.69% |
| Tesla | -17.60% | -13.78% |
| Magnificent 7 | 14.06% | 18.07% |
| S&P 500 | 12.81% | 15.00% |
Results inside the group were far apart. Nvidia led the year to date at 25.44%, and Apple followed at 22.74%. Tesla fell 17.60% for the year and 13.78% over one year.
Alphabet had the best one-year return at 40.00%. Microsoft was nearly flat at 0.03%. The Motley Fool describes the group as more volatile than the index, “for better and for worse.”
Meta’s 10.30% return for the year is well above its 2.47% one-year return. Alphabet shows the reverse, with 9.74% for the year and 40.00% over one year.
Only Nvidia and Apple beat the S&P 500 for the year to date. Over one year, three of the seven beat the index: Alphabet, Apple and Nvidia.
Tesla was the only member down on both measures. Six of the seven stocks were positive for the year to date.

Long-Term Returns Over 1, 5 and 10 Years
Fidelity published returns as of Feb. 25, 2026. Over 10 years, all seven stocks gained more than 500%.
| Company | 1-year | 5-year | 10-year |
|---|---|---|---|
| Alphabet (GOOG) | 76.5% | 208.2% | 787.0% |
| Amazon (AMZN) | -1.0% | 37.8% | 658.8% |
| Apple (AAPL) | 11.0% | 126.7% | 1,033.7% |
| Meta Platforms (META) | -0.6% | 156.7% | 504.9% |
| Microsoft (MSFT) | 0.7% | 74.9% | 668.9% |
| Nvidia (NVDA) | 54.4% | 1,369.3% | 24,345.0% |
| Tesla (TSLA) | 37.9% | 83.6% | 3,239.2% |
Nvidia led by a wide margin. It returned 24,345.0% over 10 years and 1,369.3% over five. Tesla was second over 10 years at 3,239.2%, and Apple was third at 1,033.7%.
Meta had the lowest 10-year return at 504.9%. That is still a gain of more than 500%. Over one year, Amazon and Meta were slightly negative, and Microsoft gained 0.7%.
Fidelity notes that growth gets harder at this size. Doubling from $3 trillion to $6 trillion is tougher than doubling from $3 billion to $6 billion. The company also warns that these stocks have been volatile.
Alphabet had the best one-year return in Fidelity’s data at 76.5%. Nvidia followed at 54.4%, and Tesla at 37.9%. Amazon, Meta and Microsoft were all within one point of zero.
Over five years, Amazon had the lowest return in Fidelity’s data at 37.8%. Investopedia’s data, taken on a different date, shows Microsoft as the lowest. Dates and data providers explain the difference.
Fidelity’s profiles show how long the run has lasted. Alphabet is up more than 750% over the decade, Amazon and Microsoft more than 650% each, and Apple just over 1,000%.

AI Spending and the Wider Economy
MarketWatch reports that the seven companies plus SpaceX account for about $580 billion in capital spending so far in 2026. The rest of the S&P 500 combined spends about $1.4 trillion. The data came from Apex Fintech Solutions and Bloomberg.
That puts the group and SpaceX at roughly 30% of total S&P 500 capital spending. The AI build-out is the main driver of the increase.
| Group | Capital spending in 2026 | Share of total |
|---|---|---|
| Magnificent 7 plus SpaceX | $580 billion | About 29% |
| Rest of the S&P 500 | $1.4 trillion | About 71% |
The concern is about herd behavior. If one major company cuts AI spending, others may follow. That could cause a broad pullback in tech investment.
Treacy said the shift would bring challenges for growth “not just in the United States, but globally as well.” MarketWatch also stresses that market value and GDP measure different things.
Capital spending is money spent on equipment, buildings and technology. MarketWatch links the recent rise to the AI boom, which has pushed many of these companies to spend far more.
In plain terms, eight companies account for about 29% of the spending. All the other companies in the index account for about 71%.

Hedge Funds and ETF Demand
Seeking Alpha reported on Oct. 8, 2026 that hedge fund exposure to the group has hit a multi-year high. Net exposure reached nearly 22% of total U.S. holdings on the Goldman Sachs prime book as of Oct. 5.
That is the highest level since the start of 2022. It is up from a trough of about 15% in July. Gross exposure also rose above 10% of total U.S. exposure.
| Measure | Reading |
|---|---|
| Hedge fund net exposure, July low | About 15% |
| Hedge fund net exposure, Oct. 5 | Nearly 22% |
| Hedge fund gross exposure | Above 10% |
| MAGS ETF inflow, September | About $1 billion |
| MAGS ETF total net inflows | About $4.25 billion |
Koyfin data showed that Magnificent 7 ETFs had their largest monthly inflow on record in September. The Roundhill Magnificent Seven ETF (MAGS) took in about $1 billion. Its cumulative net inflows rose to about $4.25 billion.
Fidelity lists three ways to own the group. You can buy individual stocks, buy an index fund that tracks the S&P 500 or Nasdaq Composite, or buy a Magnificent 7 ETF. ETFs carry an expense ratio and other possible fees.
Hedge fund net exposure rose by about seven points in roughly three months, from about 15% in July to nearly 22%. September’s ETF inflow of about $1 billion is close to a quarter of all money MAGS has taken in.
Fidelity adds that some index funds charge no expense ratio. Magnificent 7 ETFs usually do, so buyers should check the fee before investing.

Risks, Strengths and a Spring 2026 Snapshot
Investopedia published a snapshot as of May 6, 2026. The group’s total market cap was about $23.14 trillion. Nvidia led at $5.051 trillion, followed by Alphabet at $4.787 trillion and Apple at $4.222 trillion.
| Company | 6 months | 1 year | 5 years |
|---|---|---|---|
| Alphabet (GOOG) | 38.28% | 139.70% | 227.51% |
| Amazon (AMZN) | 13.87% | 49.85% | 66.66% |
| Apple (AAPL) | 6.41% | 44.85% | 119.41% |
| Meta (META) | -0.34% | 3.69% | 90.58% |
| Microsoft (MSFT) | -16.76% | -4.29% | 64.05% |
| NVIDIA (NVDA) | 12.02% | 85.79% | 1,300% |
| Tesla (TSLA) | -8.68% | 46.44% | 80.20% |
Microsoft had the weakest six-month return at -16.76% and the lowest five-year return in the group. Alphabet had the strongest six-month return at 38.28%. Nvidia returned 1,300% over five years.
Fidelity lists three strengths: financial strength, market leadership and global operations. Each company sells in many countries, which spreads its revenue. That reach also adds geopolitical risk.
Investopedia lists several risks. They include currency swings, cyberattacks, economic downturns, trade tensions, key person risk, market saturation, regulation and fast technology change.
Fidelity adds that many investors see the group as costly. Prices assume future growth, so a miss could hurt values. It also warns about concentration, since many large-cap growth funds already hold some or all of the seven.
The group differs from FAANG, a term coined in 2013 for Meta, Amazon, Apple, Netflix and Alphabet. FAANG centers on internet services, e-commerce and digital media. The Magnificent 7 adds software, hardware, chips and electric vehicles.
Investopedia says size brings regulatory risk. Rules on data privacy, antitrust and international trade can all affect these companies.
Inflation matters too. It raises costs for materials and labor, and it can cut consumer spending. Central banks often respond with higher rates, which raise borrowing costs for companies.

Key Takeaways
The Magnificent 7 hold about 35% of the S&P 500 and are worth close to $25 trillion. In 2026 they have edged past the index, with 14.06% year-to-date versus 12.81%.
Returns inside the group vary widely. Nvidia and Apple lead in 2026, while Tesla is down 17.60%.
Capital spending, hedge fund exposure and ETF inflows all point to growing concentration. The data in this article shows how much of the market now rests on seven companies.
Sources
- What are the Magnificent 7 stocks? (Fidelity Learn)
- The ‘Magnificent Seven’ are now big enough to move the economy. Why that could be a problem. (MarketWatch)
- The Magnificent Seven Stocks: Market Cap, S&P 500 Weight, and Returns (The Motley Fool)
- Hedge funds push Mag 7 exposure to highest level since 2022 – Goldman (Seeking Alpha)
- Magnificent 7 Stocks: What You Need to Know (Investopedia)
- US – Magnificent Seven Total Market Cap & Share of S&P 500 (MacroMicro)


