






TLDR
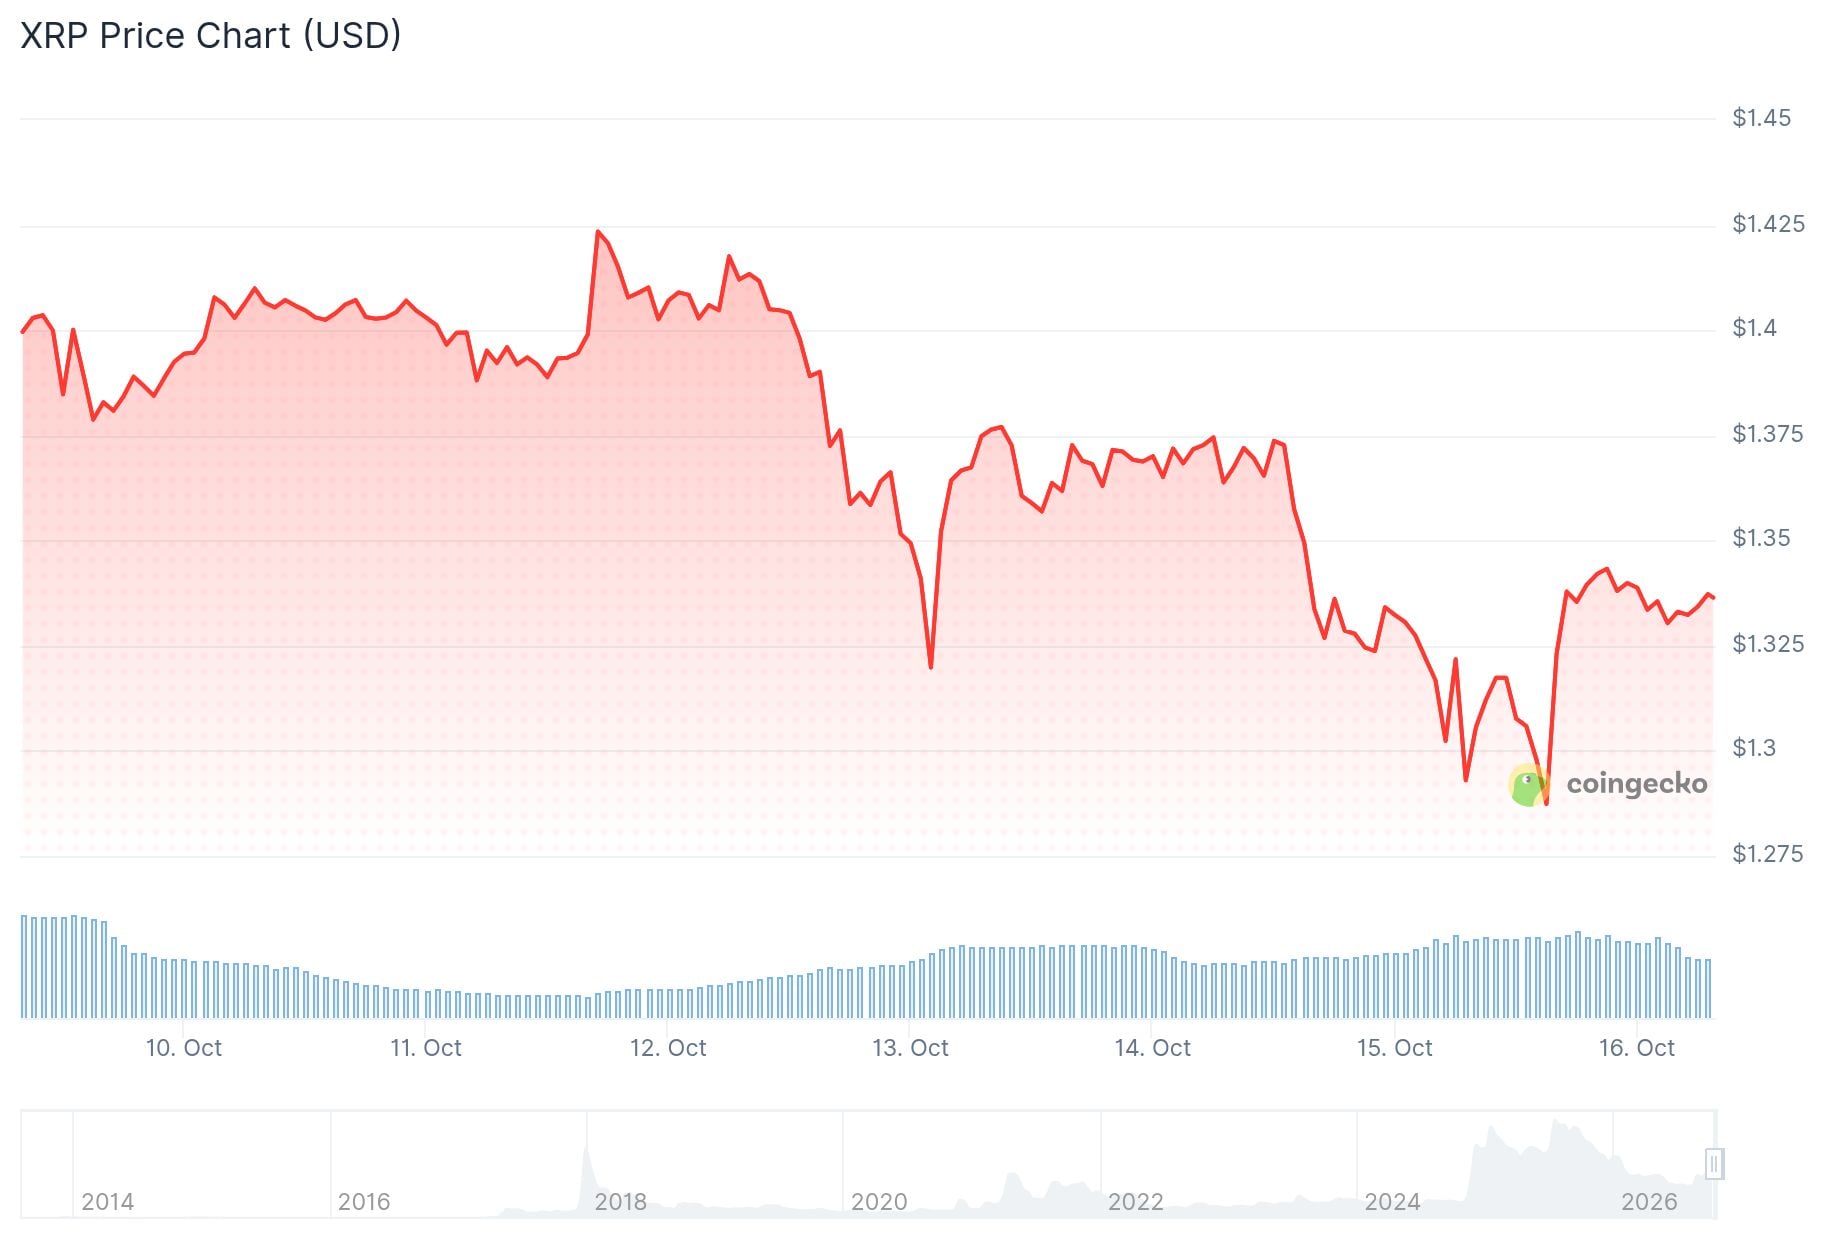
- XRP fell nearly 6% after a hotter-than-expected U.S. PPI report, then recovered to a session high of $1.34.
- Crypto liquidations reached $1.7 billion over four days, while XRP ETFs drew just $13 million in October.
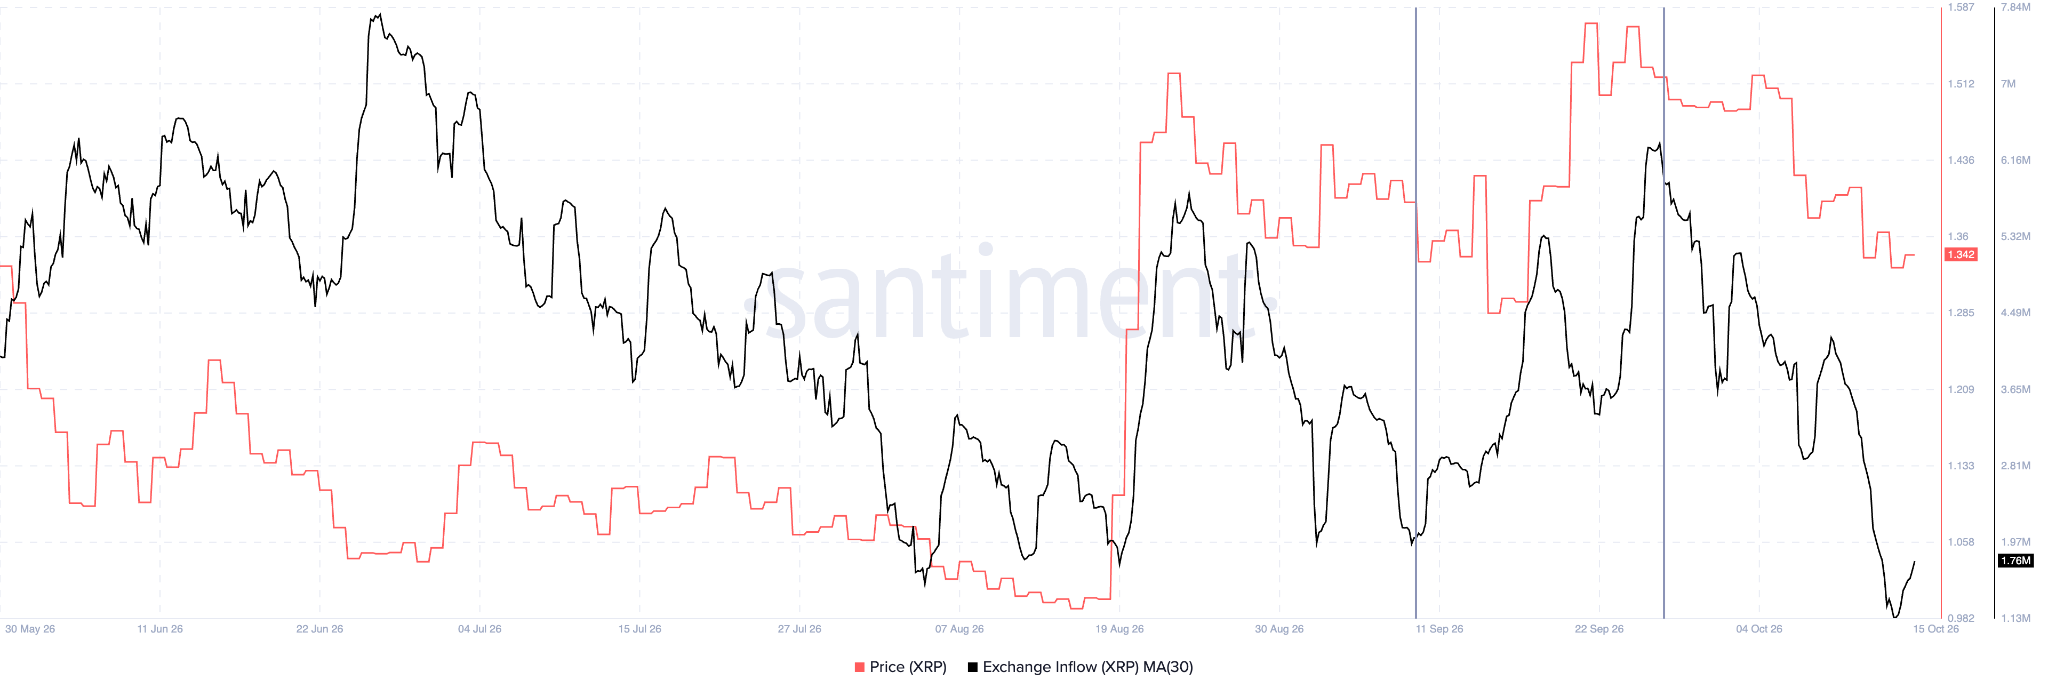
- XRP exchange inflows have dropped since a spike in September, which may ease selling pressure.
- Analyst Ali Charts is watching $1.25 as a possible buying area, with targets at $1.42 and $1.60.
- A move above $1.45 is needed to confirm a trend reversal, while a break below $1.30 could expose $1.25.
XRP dropped by nearly 6% during Wednesday’s session after the U.S. Producer Price Index (PPI) came in far above forecasts. Analysts expected a 0.5% monthly rise, but the report showed 1.3%. Higher energy prices continue to push wholesale costs up.
Core PPI also beat expectations, rising 0.7% against a forecast of 0.3%. The report followed a Consumer Price Index reading a day earlier that also topped expectations.
Bulls stepped in at the $1.32 support area. XRP then climbed to a session high of $1.34, and it traded at $1.34 on October 16, up 2.18%.
Crypto liquidations have reached $1.7 billion over the past four days as a long squeeze played out. In the last 12 hours, more than $100 million in short positions were wiped out after the market reversed.
The wider market also took a hit. The total crypto market cap fell 3.24% to $2.71 trillion, Bitcoin slipped below $81,000, and Ethereum traded under $2,400.
ETF Flows and Exchange Data
Sentiment toward XRP remains soft. Net inflows to XRP-linked ETFs total only $13 million in October, according to SoSoValue. A simple run rate points to $26 million for the month, a 79% drop from September.
Other data shows a longer streak. U.S. spot XRP ETFs took in about $11.3 million from October 5 to October 9, extending their weekly inflow run to 13 weeks. Bitwise added $10.55 million, and Franklin Templeton’s XRPZ drew $4.1 million. Canary Capital’s XRPC saw $3.34 million in outflows.

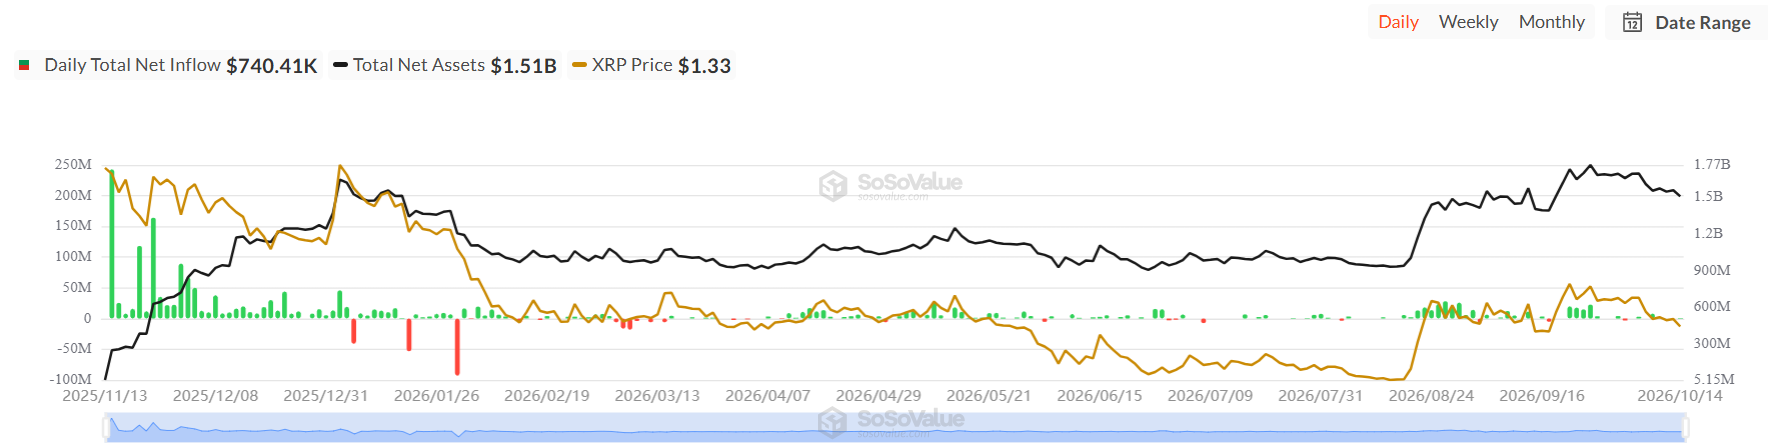
SoSoValue’s October 14 dashboard showed cumulative inflows of $1.80 billion and net assets of $1.51 billion.
On-chain data from Santiment shows exchange inflows spiked between September 10 and September 27, then declined. That suggests holders are no longer sending as many tokens to exchanges to sell.
Crypto analyst Ali Charts shared a more cautious view on X. He said XRP is trading inside a parallel channel on the hourly chart and could still fall toward the lower boundary near $1.25.
XRP REBOUND INCOMING!?$XRP appears to be trading inside a parallel channel on the hourly chart.
This structure suggests XRP could still drop toward the lower boundary around $1.25 before seeing a meaningful rebound.
That’s the level I’m watching for a potential buying… pic.twitter.com/Et9Q11p08w
— Ali Charts (@alicharts) October 15, 2026
Ali said that is the level he is watching for a buying opportunity. A bounce could send XRP to the channel’s midpoint at $1.42, or to the top near $1.60.
XRP Chart Analysis
On the daily chart, XRP reacted positively right after dipping below $1.32, a level that has been key support for weeks. Strong buying volume appeared there. If XRP holds above it, the pullback may have found a floor.
On the four-hour chart, the relative strength index stood at 32.82, near oversold territory. The MACD line sat below its signal line. The price needs to clear $1.45 to confirm a reversal, so the next level to watch is $1.45. A four-hour close below $1.30 would put $1.25 in view.


