






TLDR
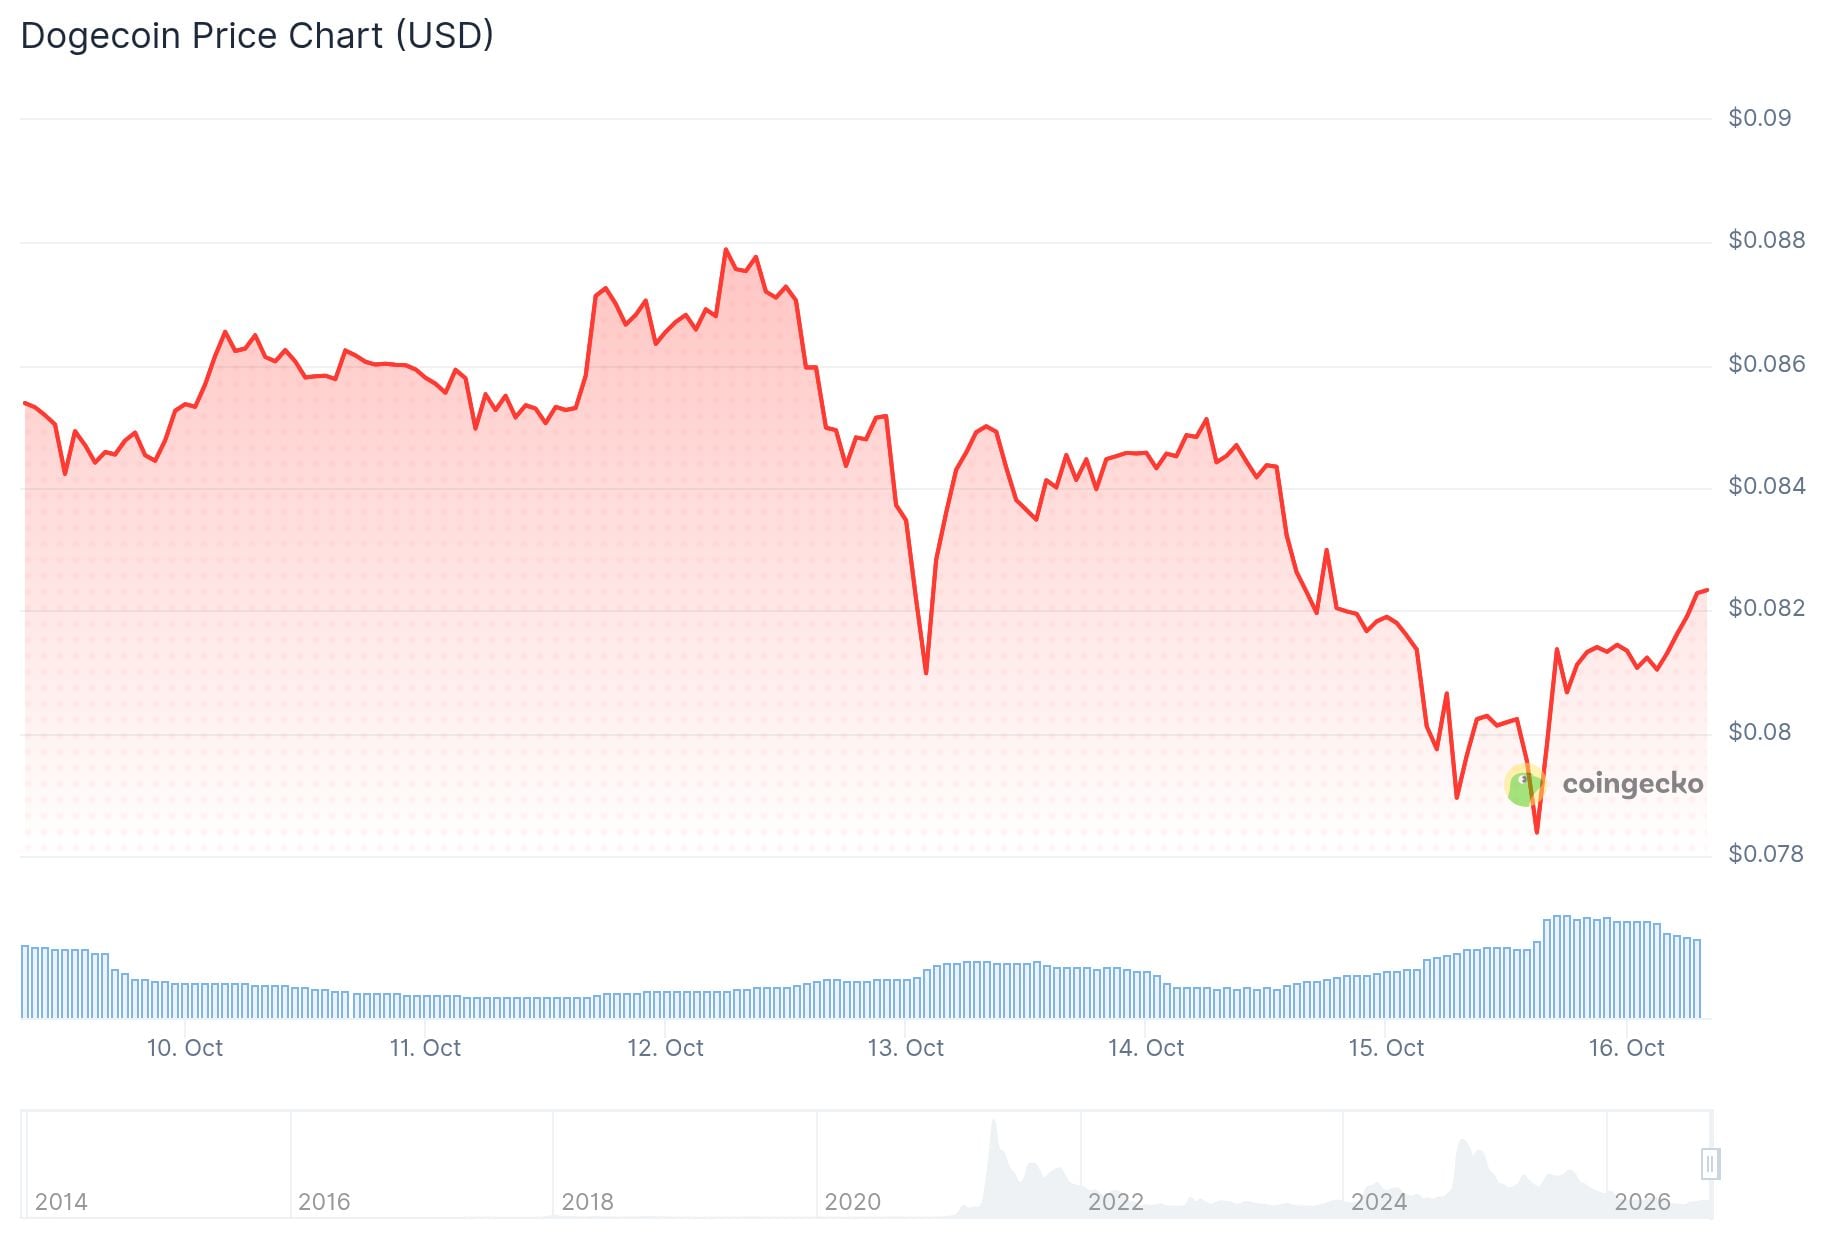
- DOGE trades near $0.0789 after sliding below the $0.0800 level on Thursday.
- Dogecoin spot ETFs saw outflows of about $139,000 on Wednesday and $399,000 the day before.
- US inflation rose to 3.7% in September, above forecasts of 3.6%.
- Analyst Trader Tardigrade points to an inverse head and shoulders pattern with a neckline near $0.1.
- Whales moved 300 million DOGE, worth about $24 million, according to DogeGod.
Dogecoin (DOGE) extended its correction on Thursday and traded at $0.0789. The $0.0800 level now acts as supply and limits recovery attempts. Investors have also pulled back on risk as inflation worries persist.
US inflation data added to the pressure. The Consumer Price Index showed headline inflation rose to 3.7% in September. That was above forecasts of 3.6% and August’s 3.4%.
Higher oil and energy prices are driving the rise. With a Federal Reserve policy decision ahead, that keeps macro uncertainty in play.
ETF Flows and Derivatives
Dogecoin spot ETFs recorded outflows of roughly $139,000 on Wednesday. The day before, outflows were $399,000. Cumulative inflows stand at $15 million, with net assets of $14 million.
Futures open interest was 15.2 billion DOGE on Thursday, according to CoinGlass. That is down from 15.5 billion DOGE a day earlier. It also sits below the October high of 16.6 billion DOGE.
Chart Analysis
On the daily chart, DOGE trades below all major exponential moving averages. The 100-day EMA is at $0.0859 and the 50-day EMA is at $0.0871. The 200-day EMA at $0.0928 and the SuperTrend line at $0.0937 sit higher still.
The MACD is below zero and the RSI is near 35, close to oversold territory. With no clear support on the daily chart, traders look to the psychological levels at $0.0750 and $0.0700. The level to watch next is the 100-day EMA at $0.0859, which bulls would need to reclaim to ease the pressure.

Analyst Trader Tardigrade sees a longer-term picture on the monthly chart. He says Dogecoin is forming an inverse head and shoulders, a pattern that he notes appeared before the 2021 surge. Back then, the neckline was at $0.00244 and the price later reached $0.739.
$DOGE/monthly 🔥
Dogecoin is forming an Inverse Head and Shoulders.
❇️ Same pattern appeared before the 2021 surge
❇️ Neckline back then: $0.00244 → top: $0.739 (+30,000%)Now the neckline sits at $0.1, and price is pressing right up under it.
A monthly close above the line… pic.twitter.com/b9utTcVEsv
— Trader Tardigrade 🧬 (@TATrader_Alan) October 15, 2026
Now the neckline sits at $0.1, and price is pressing up under it. He says a monthly close above that line would confirm the breakout.
Whale Activity and Analyst Targets
Whale transactions have also drawn attention. According to DogeGod, whales moved 300 million DOGE, worth about $24 million. The amount alone does not show whether the whales are buying, selling or moving tokens between their own wallets.
Dogecoin whales made another transactions worth 300 million $Doge recently.
Equivalent to $24m. pic.twitter.com/0PoASe40Kn
— dogegod (@_dogegod_) October 15, 2026
Analyst Crypto Patel is focused on a long-term descending trendline and a multi-year accumulation zone. He says DOGE is retesting this structure. He identifies $0.1186 as the key resistance level to watch.
Crypto Patel lists three targets if a breakout holds. The first is $0.2818 and the second is $0.7559. The third is $2, which he links to the next bull market.
The weekly chart also shows a bearish tilt. DOGE holds below the 50-week EMA at $0.1086, the 100-week EMA at $0.1310 and the 200-week EMA at $0.1335. The weekly RSI sits near 43.
As of Thursday, DOGE trades at $0.0789, with the $0.0800 level capping the price.


