






TLDR
- Bitcoin dropped from $79,500 to below $76,000, triggering around $547 million in liquidations
- Long positions took the heaviest hit, with over $659 million in forced closures in one 24-hour window
- U.S. spot Bitcoin ETFs saw $307.45 million in net inflows on Aug. 21, a five-day inflow streak
- Analysts warn of downside targets between $71,000 and $68,000 if selling pressure continues
- Key macro events including PCE data, Nvidia earnings, and Jackson Hole could set BTC’s next direction
Bitcoin slid from around $79,500 — its highest level in months — to below $76,000 in a sharp sell-off that caught leveraged traders off guard. The drop triggered approximately $547 million in crypto liquidations before buyers stepped in.
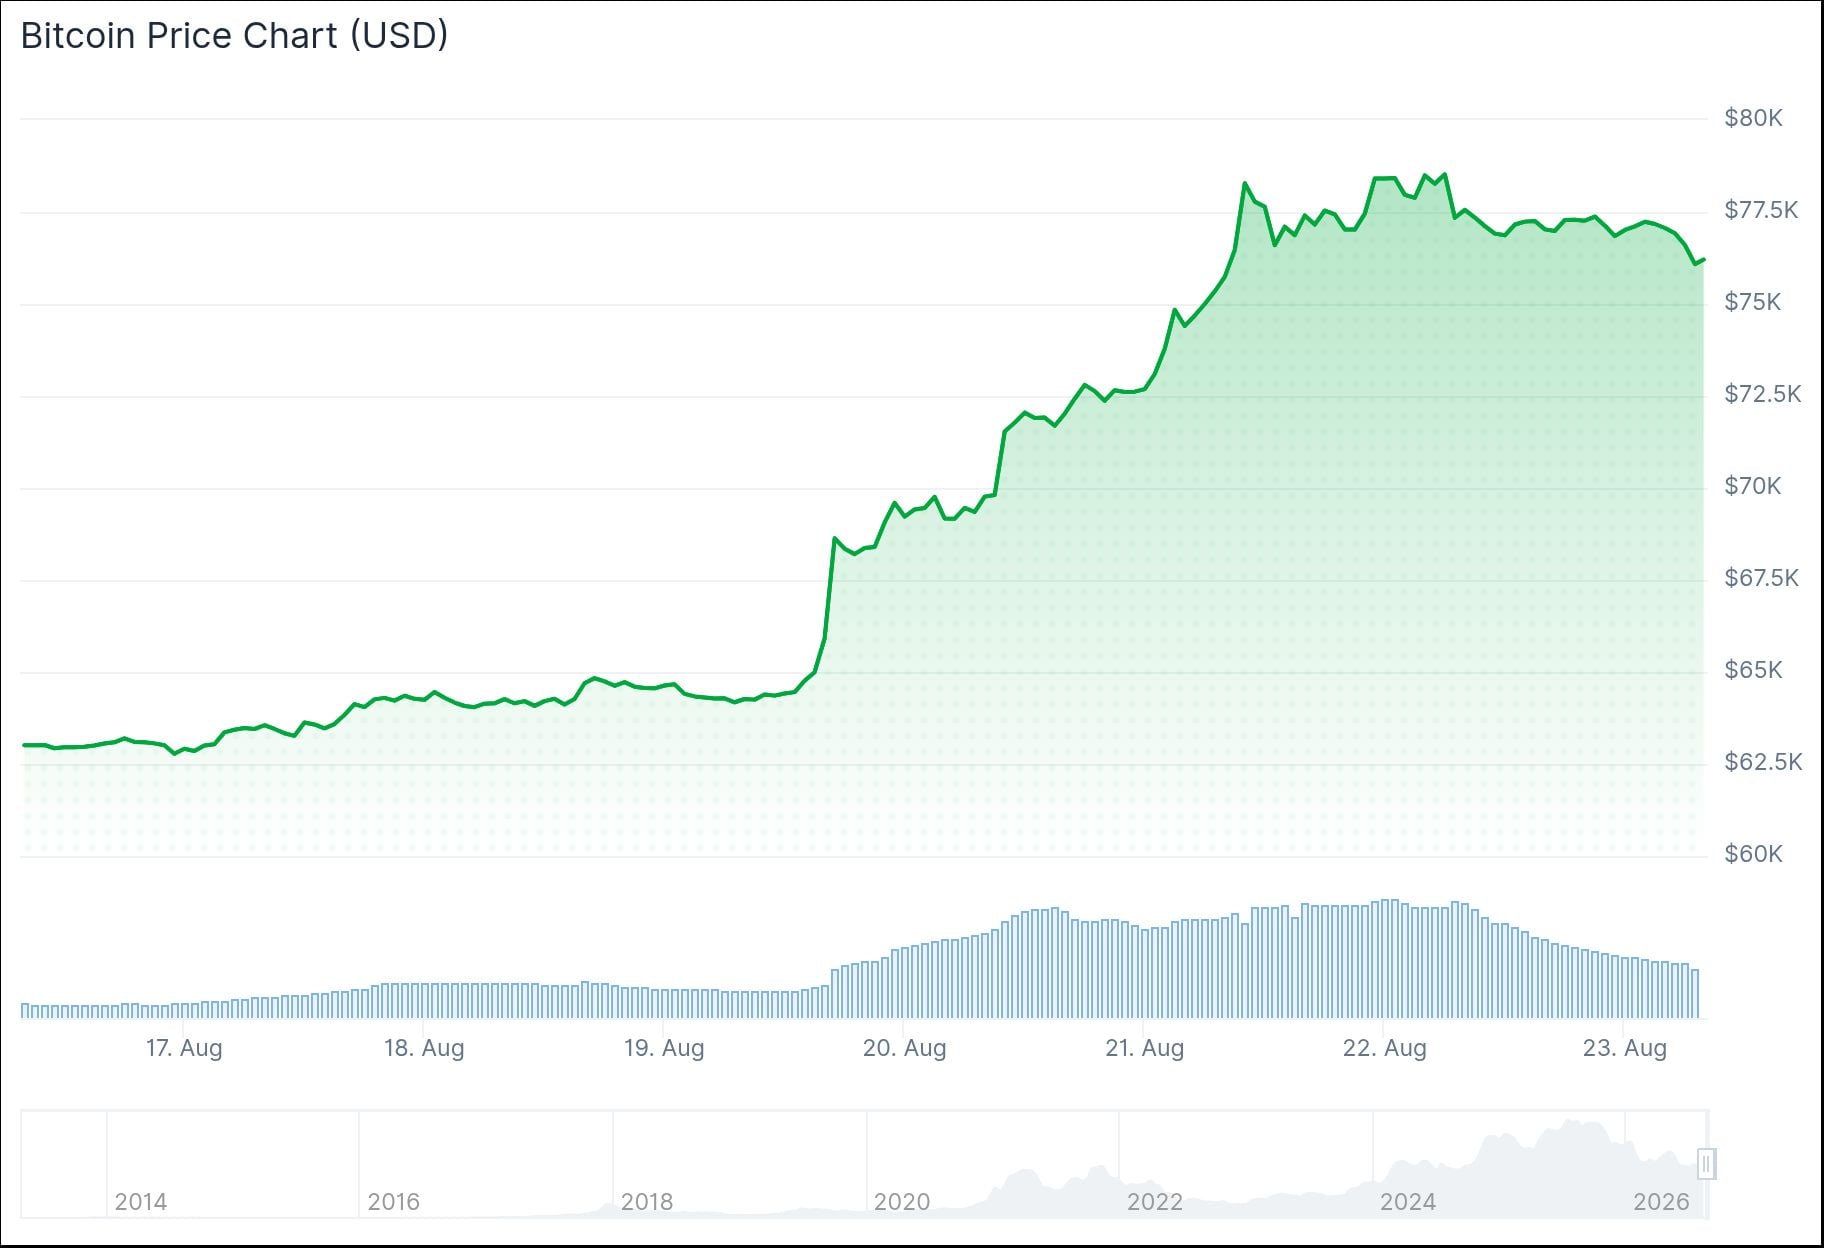
At the time of writing, BTC was trading around $77,291, down 0.43%.
The move exposed how fragile the market was beneath the surface. Long positions bore the brunt, accounting for roughly $659 million in forced closures compared to just $148 million on the short side — a ratio of more than four to one.
On platforms like Hyperliquid, single long liquidations ranged from $23 million to $48 million, showing how exposed some individual traders were.
On-chain analyst Maartunn pointed to heavy positioning among bullish traders as the main trigger. Once Bitcoin entered the liquidation zone, forced selling accelerated the decline. Maartunn noted that liquidity is now building above $78,300, with additional clusters lower toward $68,000.
Why the dump? 📉
Too many traders were positioned for higher prices. Liquidity piled up below, and once price moved into it, wooosh… gone.
Now liquidity sits above the recent $78,300 high, while multiple clusters form a staircase down toward $68,000. https://t.co/mpdOJTYElM pic.twitter.com/swzWBzGPMz
— Maartunn (@JA_Maartun) August 22, 2026
What Analysts Are Watching
Analyst P4 Provider flagged $79,000 as a key resistance level after Bitcoin swept liquidity above that area. P4 Provider also pointed to bearish RSI divergence, rising USDT dominance, and elevated funding rates as warning signs. Downside targets range from $77,000 to $71,000, with $70,000 as a deeper level if selling picks up.

Crypto analyst Daan Crypto Trades (@DaanCrypto) noted on social media that the current weekly BTC candle is within the top 5% largest candles seen in the past eight years. He pointed out that the monthly candle is less extended, sitting in the top 32 percentile. Daan added that in 61% of bullish months, the high comes in later than it did at that point — suggesting the current high could still be taken out, though he was clear there are no guarantees.
$BTC The current weekly candle is within the top 5% biggest ones in the past 8 years.
But the monthly candle isn't even that extended (yet). It is currently in the top 32 percentile.
In 61% of bullish months the high even gets put in later than it did here.
So obviously no… pic.twitter.com/POxvClvpvK
— Daan Crypto Trades (@DaanCrypto) August 22, 2026
This pattern is not new. Back in May, Bitcoin’s slide below $75,000 produced around $923 million in total liquidations, with longs accounting for over 90% of losses.
Macro Events Ahead
Despite the sell-off, demand signals remain present. U.S. spot Bitcoin ETFs logged $307.45 million in net inflows on Aug. 21, extending a five-day inflow streak.
On Aug. 26, the U.S. Bureau of Economic Analysis will release Q2 GDP data and July PCE inflation figures. Nvidia also reports earnings that day. Fed Chair Kevin Warsh speaks at Jackson Hole on Aug. 28.
Holding $77,000 is the immediate focus for Bitcoin bulls.


