


There are many ways to measure the performance of your Bitcoin trading system’s results. When you measure the relative strength (RS) of Bitcoin vs. tech stocks or other cryptos and key financial markets, you obtain a real-world view of its comparative strength (or weakness). This data can help you make important investment decisions. It can even help you forecast major reversals, allowing you to get a jump on other investors.
This article will show you the comparative relative strength (RS) of Bitcoin vs. tech stocks (ticker: QQQ, the NASDAQ 100 tracking stock) over six key time periods. You’ll see how BTCUSD fared against QQQ during the past 3-, 6-, 12-, 24- and 36-month periods. You’ll also see how the king of coins dramatically outperformed QQQ over the past five years. Any market that can outperform a stock index containing the likes of Apple, Netflix, Amazon, and Google is a market to respect. In Bitcoin’s case, it’s been trouncing those particular tech-index giants for the past five years.
Bitcoin vs. Tech Stocks: Key RS Metrics
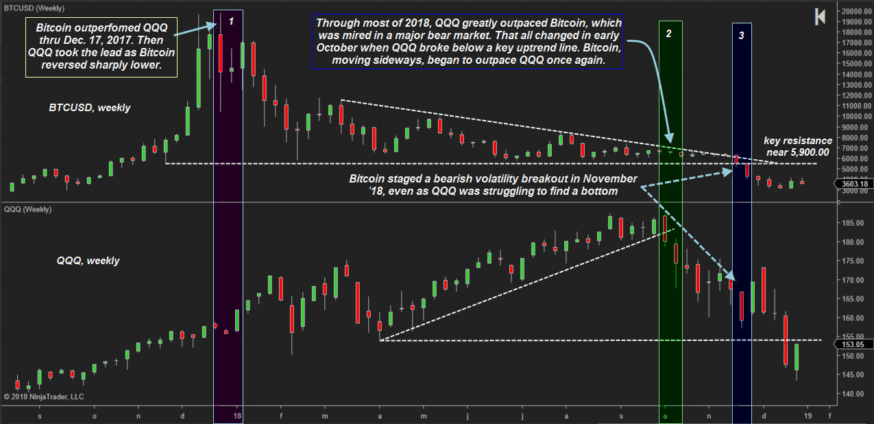
The Bitcoin (BTCUSD) vs. QQQ RS stats since December 2017’s all-time-high (ATH) are clearly stacked in favor of QQQ. At least right now. All seasoned traders know that markets can change direction in a flash, rendering even the best-researched forecasts useless. However, both BTCUSD and QQQ are in technical bear markets now. Additionally, QQQ’s monthly chart looks especially scary to some market technicians. Many are calling for even lower lows in tech stocks in 2019.
BTCUSD’s timing forecast charts suggest that January 2019 could see a major rally erupt from a series of simultaneous cycle lows. In contrast, QQQ’s cycle charts suggest a potential bullish reversal far later, sometime in late Q1 or even Q2 of 2019.
[thrive_leads id=’5219′]
Near-Term Stats (One Year or Less)
3-month BTCUSD performance: (44.60) percent
3-month QQQ performance: (17.64) percent

RS ratio of 2.53 to 1 in favor of QQQ
6-month BTCUSD performance: (39.55) percent
6-month QQQ performance: (9.83) percent
RS ratio of 4.02 to 1 in favor of QQQ
12-month BTCUSD performance: (75.89) percent
12-month QQQ performance: (2.23) percent
RS ratio of 34.02 to 1 in favor of QQQ
The bear market Grizzlies have certainly been hot on Bitcoin’s trail since late December 2017. QQQ, although actually down a couple percent since then, has actually outperformed BTCUSD by a factor of 34 to 1 over the past twelve months. Yet over the most recent 3-month window, the RS ratio has shrunk to a more rational 2.53 to 1. As mentioned earlier, the 2019 cycles forecast for BTCUSD also has the potential to turn the coin into a QQQ outperformer in the coming year. Extreme RS ratio figures are generally not sustainable, typically reverting to the mean. Later in the article, you’ll see how identifying such extremes in RS can set up potentially powerful investment opportunities.
Long-Term Stats (Two Years or More)
24-month BTCUSD performance: + 295.90 percent
24-month QQQ performance: + 26.68 percent
RS ratio of 11.09 to 1 in favor of BTCUSD
36-month BTCUSD performance: + 777.86 percent
36-month QQQ performance: + 36.01 percent
RS ratio of 21.60 to 1 in favor of BTCUSD
5-year BTCUSD performance: + 418.13 percent
5-year QQQ performance: + 74.87 percent
RS ratio of 5.58 to 1 in favor of BTCUSD
Apples vs. Crypto
You don’t need to be a statistician to realize that the past 12 months have been a rough time for Bitcoin investors. However, looking at the RS of the coin across the most recent 2-, 3-, and 5-year periods suddenly transforms it into a superstar. This was particularly so in the 3-year lookback period, outperforming QQQ by more than 20 times!
Key NASDAQ 100 Components Underperform
If you had invested in shares of Netflix (NFLX) and BTCUSD on December 27, 2015, your crypto units would be up significantly more than your NFLX stake:
36-month BTCUSD performance: + 777.86 percent
36-month NFLX performance: + 120.00 percent
RS ratio of 6.48 to 1 in favor of BTCUSD
Here’s a look at the 3-year performance comparison of Google (GOOGL) vs. BTCUSD:
36-month BTCUSD performance: + 777.86 percent
36-month GOOGL performance: + 34.40 percent
RS ratio of 22.61 to 1 in favor of BTCUSD
Seeing the Forest for the Trees
Eventually, Bitcoin’s bear market will end. It may even begin to outperform QQQ in 2019 and beyond as new futures contracts and exchanges draw more investor interest. Rising price cycles may also coincide with that renewed public focus on the coin.
Currently, QQQ is outperforming BTCUSD (most recent 12-month period) by an RS factor of 34 to 1. Think about that for a moment. Unless BTCUSD is soon destined to become worthless or QQQ is going to hit extreme new ATHs soon (both scenarios extremely unlikely), that outlandish RS ratio seems unsustainable.
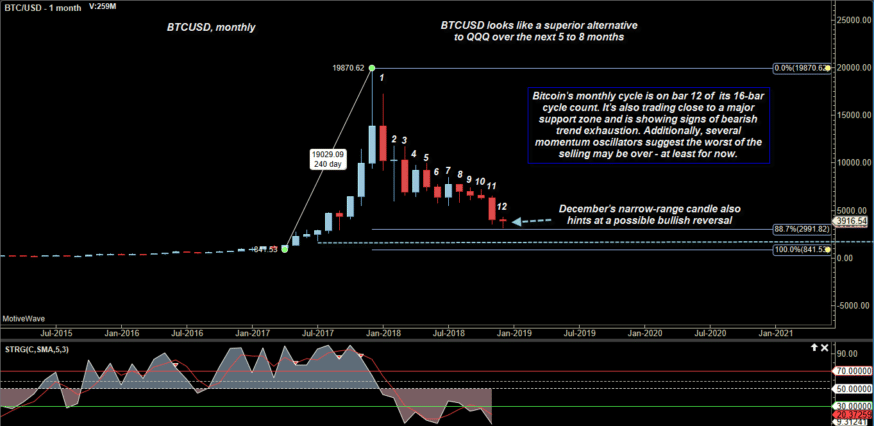
While novice investors are focused on what has happened, you may choose to look at that inflated RS spread and instead envision an event that has a high probability of actually happening. Here’s a recent BTCUSD monthly cycles forecast chart, followed by another chart for QQQ. Cycles analysis suggests that BTCUSD is much closer to making and sustaining a bullish trend reversal than is QQQ:
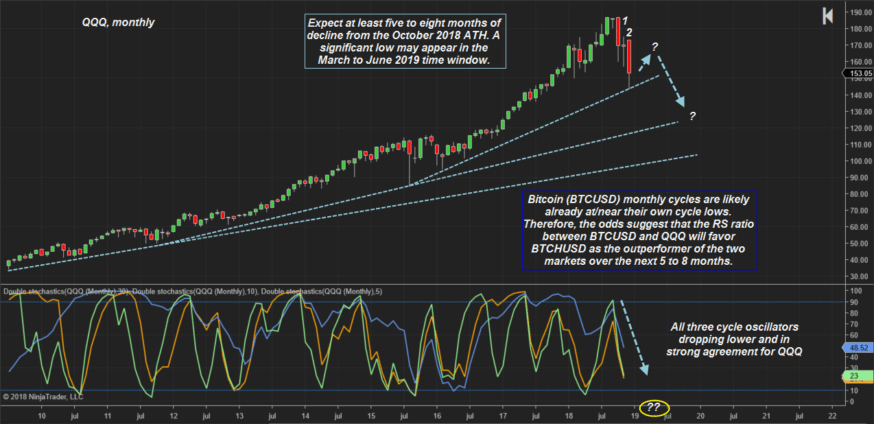
A look at QQQ’s monthly cycles scenario, which is extremely bearish:
Relative Strength Extremes and Cycles
Relative strength comparisons clearly show you what markets are leaders and laggards. Extreme bullish or bearish RS ratios can also provide you with early warning of a major reversal. That’s one of the most opportune times to put cycles analysis to work. Remember that cycles analysis isn’t a perfect mathematical science.
However, it can help you to make rational investment choices at times of extreme intermarket imbalance. In the above examples, the probabilities favor BTCUSD outperforming QQQ well into 2019. Do your own research and see if that jives with your own conclusions.


