


Bitcoin’s bear market. You’ve likely been hearing this phrase for most of 2018. Perhaps you aren’t exactly clear on what a bear market is. Maybe you’re not sure how to identify one. More importantly, you want to know when this bear market will be a done deal. This article will provide the bitcoin bear market info you’re looking for.
What Exactly Is a Bitcoin Bear Market?
Bear market definitions may vary, depending on who’s got the mic. Here’s a couple of popular interpretations:
- A 20 percent decline from the most recent all-time high.
That’s a useful figure, however, some technicians add an additional qualifier:
- A 20 percent decline from the most recent all-time high, with a duration of two months or greater.
Using the first definition, Bitcoin (BTCUSD) officially entered a bear market on December 21, 2017, when it closed at 15,632.12. The decline was extremely fast, occurring only four days after reaching its all-time high (ATH) of 19,870.62. Many other cryptos experienced similar descents into bear markets, confirming the sell-off’s broad-based nature.
Applying the second, more specific definition yields a different result, however. Using this second interpretation, Bitcoin entered a bear market on February 17, 2018 (two months after the Dec 17, 2017, ATH). Its closing price was 11,097.21, far below the broad-definition, 20 percent decline figure of 15, 632.12. Bitcoin remains in a long-term bear market, trading at 4,167.00 as of this writing (December 24, 2018).
[thrive_leads id=’5219′]
Bitcoin Bear Market Stats
Here are my chart-based calculations for each Bitcoin bear market going back to 2011. I’m using the broad definition of a 20 percent decline from the most recent ATH. Time duration and maximum percent loss are included. The time needed for Bitcoin to move from the bear market low to the next ATH is also included. Dates are calculated on a week-ending (Saturday) basis.

Let’s start with the most recent bear market:
December 17, 2018, to December 15, 2018
Duration: 363 days
Max drawdown: (84.00) percent
Time needed until next ATH: To be determined
September 2, 2017, to September 16, 2017
Duration: 14 days
Max drawdown: (40.12) percent
Time needed until next ATH: 42 days
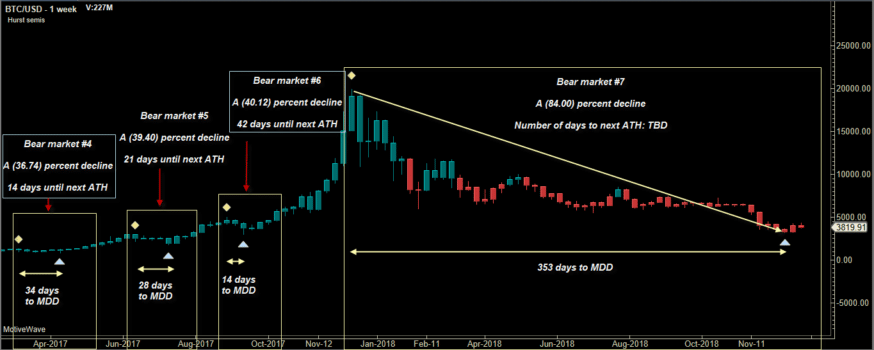
June 17, 2017, to July 15, 2017
Duration: 28 days
Max drawdown: (39.40) percent
Time needed until next ATH: 21 days
March 11, 2017, to April 15, 2017
Duration: 34 days
Max drawdown: (36.74) percent
Time needed until next ATH: 14 days:
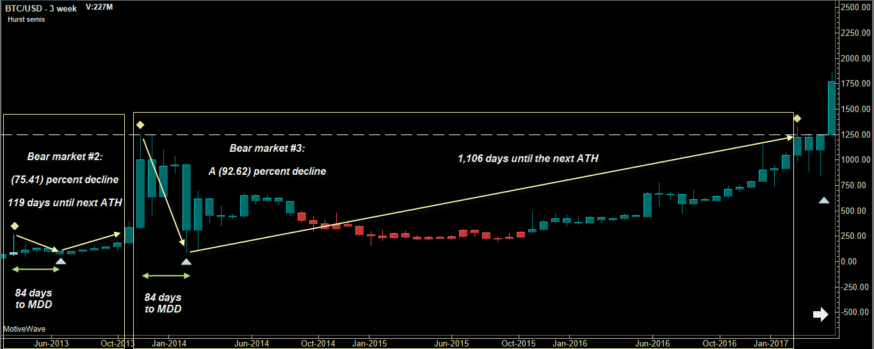
November 30, 2013, to February 22, 2014
Duration: 84 days
Max drawdown: (92.62) percent
Time needed until next ATH: 1,106 days
April 13, 2013, to July 6, 2013
Duration: 84 days
Max drawdown: (75.41) percent
Time needed until next ATH: 119 days
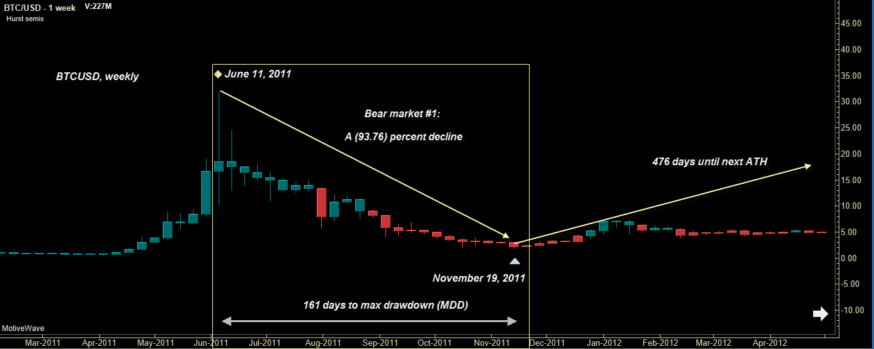
June 11, 2011, to November 19, 2011
Duration: 161 days
Max drawdown: (93.76) percent
Time needed until next ATH: 476 days
A Wide Range of Outcomes
Statistical analysis is more reliable when at least 30 datasets are included. Don’t attempt to read too much into this very small, seven-sample bear market evaluation. That said, here are some interesting Bitcoin bear market stats for your consideration:
Smallest drawdown: (36.74) percent
Largest drawdown: (93.76) percent
Longest drawdown: 363 days
Shortest drawdown: 14 days
Shortest time between max drawdown and the next ATH: 14 days
Longest time between max drawdown and the next ATH: 1,106 days
Average drawdown percent: (60.76) percent
The average duration of drawdown: 110 days
The average time between max drawdown and the next ATH: 296 days
Data source: CryptoCompare via MotiveWave Ultimate
Statistical Observations
The recent bear market (Dec. 2017-Dec. 2018) needed 363 days to go from its ATH to its ultimate low. That’s more than three times longer than average. This suggests that Bitcoin sellers have been far more aggressive than buyers.
The nearly 93 percent decline witnessed between November 2013 and February 2014 took only 84 days to complete. Once the bottom was in place, it took a whopping 1,106 days for Bitcoin to achieve a new ATH (March 2017). Bitcoin ’s nearly 94 percent decline in 2011 took nearly 500 days before reclaiming a new ATH. The NASDAQ 100 index (QQQ) decline of (83.6) percent (March 2000 to October 2002) required an incredible 16.75 years before being able to make a new ATH.
After an 83 percent decline (or greater), expect to wait a while before witnessing a new ATH. Part of the reason for this is that the investors who suffered major losses fail to return to the market once the trend reverses higher.
Therefore a new group of enthusiastic Bitcoin investors needs to step in to take their place before a new bull market can begin. This can take years, depending on investor sentiment and economic conditions.
Forecasting the Next Bitcoin ATH
It takes an average of 296 days for Bitcoin to travel from a bear market low up to a new ATH. Adding that figure to the recent bear market low date of December 15, 2018, suggests that a new ATH won’t be seen until around October 8, 2019. However, if it takes 1,106 days (the current record) to make the next ATH, you might anticipate December 2021 to be its possible ETA. More likely is that the next Bitcoin ATH will arrive somewhere between 296 and 1,106 days after December 15, 2018. Start marking your calendars!
However, if the recent lows of December 15, 2017, fail to hold, then all bets are off. A new set of calculations will need to be run for the bear market decline that began in December 2017.
Bearish Trend vs. Bear Market
The bear market definition is certainly useful. However, it may not provide you with a complete array of in-context, tradable technical knowledge. For example, what if Bitcoin makes a new ATH in late 2019, drops by 25 percent in three weeks (technically, a bear market) and then sets up a picture-perfect swing trade buy setup?
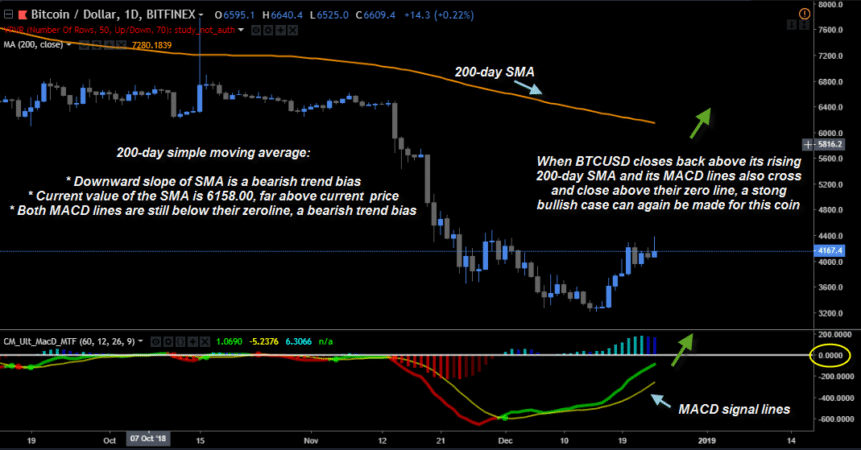
Is that a no-touch trade setup, simply because it occurs within the textbook definition of a bear market? No, of course not. It might even turn out to be a big winner, especially if the price is above its 200-period SMA. That’s why you need far more than a blunt-force definition to help you determine not only the market’s bias (bull or bear) but also its trend. Here are some highly-specific technicals that can help you determine if Bitcoin’s trend is bearish:
- The closing price should be below the 200-period simple moving average (SMA).
- The moving average should be sloping downward, confirming a strong bearish bias.
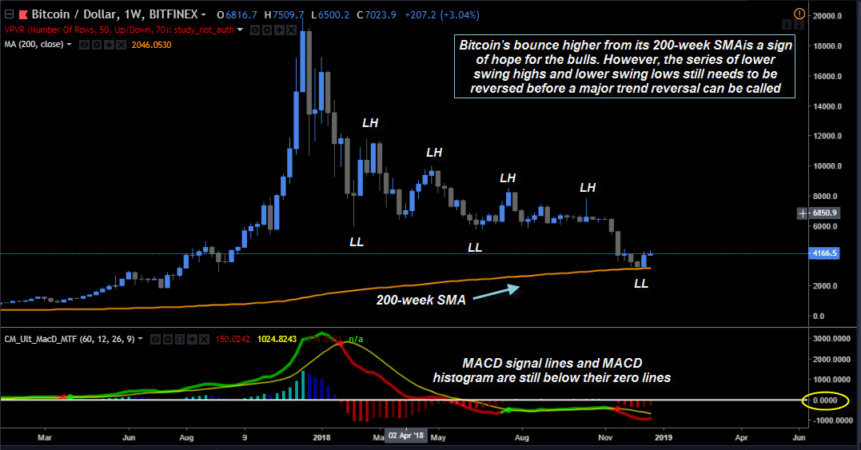
- Bitcoin should also be making a series of lower swing highs and lower swing lows.
If you see all three of those qualifiers on your Bitcoin chart, a strong bearish trend is in control. Most likely, the price will be trading at least 20 percent below its recent ATH any time they’re all in agreement. You should not be looking to take long trades at all.
However, you can choose to short rallies, short breakdowns or even choose to wait the market out. Patiently waiting for a bear market to end may be the safest strategy for newer traders and investors.
When Will This Bear Market End?
Here are some clues to help you determine when this long bear market will be complete:
- The weekly RSI (14) needs to make two consecutive closes above 50.
- On the daily chart, look for Bitcoin to close back above its upward-sloping 200-day SMA.
- Bitcoin’s weekly chart needs to trade above its upward-sloping 50-week SMA.
- The weekly chart MACD histogram and MACD signal lines need to be above their zero lines.
- A series of higher swing lows and higher swing highs must print on Bitcoin’s weekly chart.
- The monthly bitcoin chart should also be trading above its 10-month SMA.
When you see most or all of the above in place, Bitcoin’s bear market will be over.


