- Cycles in the Cryptocurrency Markets: What, Why, How
- Trading the First Pullback After a Bearish Trend Reversal
- Trading the First Pullback After a Bullish Trend Reversal
- Summary
Price cycles are one of the more reliable technical phenomena in the cryptocurrency markets. Their repetitive, timed nature offer you an important edge as you seek to enter/exit your trades at the most opportune time: one step ahead of your competitors.
This brief tutorial begins with a basic understanding of cycles and then demonstrate a specific pair of post-trend reversal cycle trade setups. These cycle-based setups appear in all crypto markets, use common technical indicators, and are easy to memorize. They also offer you a favorable risk/reward profile and the potential for a high percentage of winning trades.
Cycles in the Cryptocurrency Markets: What, Why, How
All liquid cryptocurrencies move in a series of price cycles. These oscillating patterns of buying and selling pressure can offer you prime low risk, high reward trade opportunities.
Chicken or the Egg?
Some traders claim that cycles exist in and of themselves and are the trigger for all tradable market moves. However, others are equally adamant that the ongoing battle between bulls and bears is the primary driver of cyclical price action. This chicken versus the egg debate continues, of course, but all you need to know is that cycles exist, are identifiable, and can offer you the opportunity for profit.

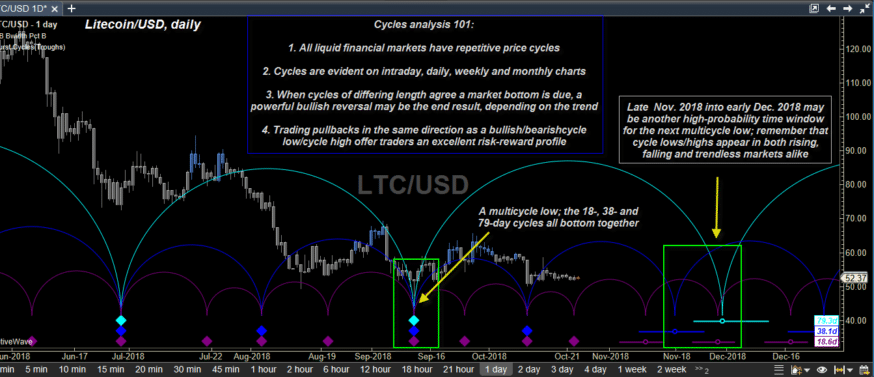
The chart above depicts three different idealized price cycles in Litecoin/USD. The software automatically determines the optimum number of price bars for each cycle. The cycle semi-circles provide a forecast for upcoming cycle lows (all cycles are measured from trough to trough). In this example, the 18.6-, 38.1- and 79.3 – day cycles tend to bottom together at key market turning points. Looking to the future, the same three cycle measurements suggest that another confluence of cycle lows may occur around late November or early December 2018.
Cycle lows occur in bullish, bearish, and sideways markets alike and can be traded successfully in all market scenarios. However, you should not attempt cycle trades during ultra-low volatility consolidations. Bullish cycles feature relatively shallow declines into cycle lows and comparatively long rallies into cycle highs. Bearish cycles feature relatively deep declines into cycle lows and comparatively small rallies into cycle highs. Cycles in trendless markets are roughly equal in price moves up/down into the cycle high/low.
Simple, but It Works
Make it a habit to calculate the number of price bars between significant swing lows in the cryptos you trade. Use as much historical data as possible for this task. You’ll be rewarded with a more accurate average cycle count. Note the 18.6- period cycle in the Litecoin/USD chart above. Most liquid crypto markets run on an 18 to 22-bar cycle across all time frames, so this is perhaps the most important cycle for you to focus on.
Cycles are powerful technical allies for serious traders, however, always use other confirming indicators before taking a new trade, such as:
- Trend
- Money flow
- Volume
- Chart patterns
- Support and resistance
At times, a cycle will expand to 24-26 bars or even contract to 13-15 bars, but the long-term average will generally mean-revert to around 18-20 bars. In the sections that follow, you’ll witness a powerful way to trade the short and long side of the crypto markets. All that you need is a 20-bar price cycle and a common trend reversal ID tactic.
Key takeaways:
- Price cycles appear in all liquid crypto markets.
- When multiple cycles bottom together, powerful reversals can occur.
- The 20-bar cycle is among the most important for you to track.
- Bullish cycles manifest shallow pullbacks and strong rallies.
- Bearish cycles manifest weak rallies and deep declines.
- Use other technical tools to confirm all cycle trade setups.
Trading the First Pullback After a Bearish Trend Reversal
Overlay a StochRSI or Double Stochastic indicator on any crypto price chart and you’ll see a repetitive oscillating pattern of buying and selling pressure. These two indicators tend to bounce from a valley (oversold) to a peak (overbought), offering you an excellent opportunity for profit. But you need to put this oscillating indicator action into proper context before you can trade it profitably.

Here’s how you can identify a low risk, high reward, short crypto cycles trade setup:
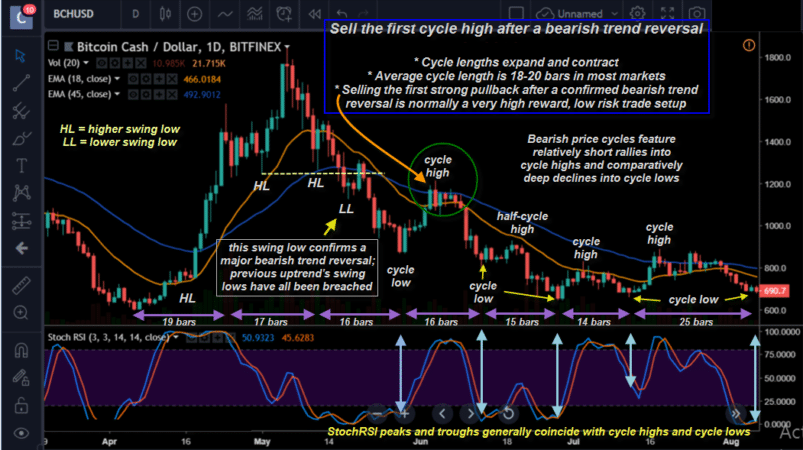
- Confirm that the trend had changed from bullish to bearish. The chart above depicts a powerful uptrend in BCHUSD that progressively exhausted and began to take out all of the significant swing lows (HL) of that uptrend.
- After the key HL point was breached (dashed yellow line), a lower-low (LL) formed, confirming the trend change. You now had a bearish trend to exploit for potential profit.
- You would have waited for the first strong rally up to a cycle high (approximately 4-7 bars) using the StochRSI or Double Stochastic oscillator to confirm the high.
- Ideally, you entered a new short trade when the price breached the lowest low of the previous two price bars. You would want to set the stop loss above the cycle high bar.
- If the trade setup failed, the stop loss would keep your loss small.
- If the trade moved in your favor, you would have held the position until the StochRSI or Double Stochastic oscillators became deeply oversold. You would also need to take partial gains along the way.
- You would have exited your short trade once 8-11 price bars had completed. Alternatively, you could use the 8-period exponential moving average (EMA) as an effective trailing stop.
[thrive_leads id=’5219′]
A Quick and Profitable Trade
The short trade depicted was indeed a nice winner, with the stop loss never in danger of being hit. Notice how the rally into the cycle high (green circle) was weak in comparison to the subsequent decline into the ultimate cycle lows (yellow arrows).
Short winning trades tend to reach max profit potential sooner than their long brethren, so be aggressive with your profit taking.
By shorting the first pullback into a cycle high after a confirmed bearish trend reversal, you’re putting the power of a new and developing trend in your favor. This is the lowest risk, highest reward trade in any market, and it’s bullish counterpart is equally powerful. Let’s examine that trade setup next.
Key Takeaways:
- Always short the first significant pullback into a cycle high after a confirmed bearish trend reversal.
- Keep your stop loss just above the cycle high.
- As the trade moves in your favor, take partial profits as key cycle oscillators become more oversold.
- Be aggressive with profit taking any time you are short any crypto market.
Trading the First Pullback After a Bullish Trend Reversal

Here’s how you can identify a low risk, high reward, long crypto cycles trade setup:
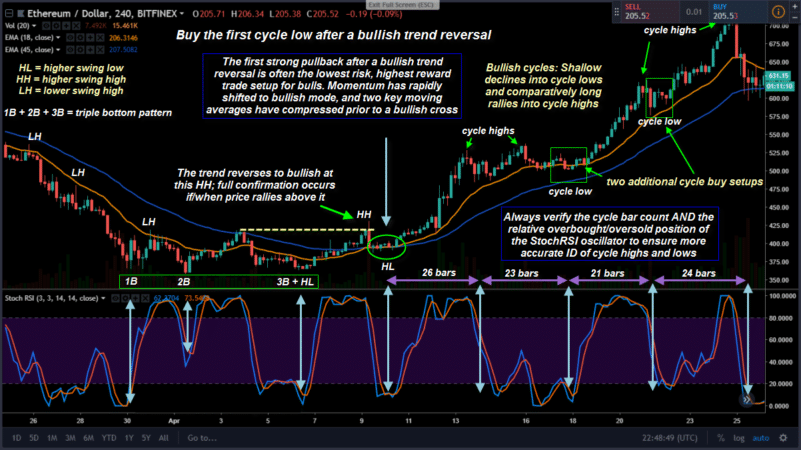
- Confirm that the trend has changed from bearish to bullish. The chart above depicts an extended downturn in ETHUSD that progressively exhausted before forming a triple bottom pattern, one that featured a higher swing low (HL).
- The previous HH point was breached (dashed yellow line) and confirmed the bullish trend change. This set up an opportunity for a possible gain.
- The first pullback into a cycle low (approximately 3-6 bars) using the StochRSI or Double Stochastic oscillator confirmed the cycle low and also formed a higher low (HL).
- Ideally, you should enter a new long trade when the highest high of the previous two price bars was finally breached. Place a stop loss just below the cycle low to keep potential losses small.
- As the long trade moved steadily higher, you would have taken partial profits as price moved far above the 18-period EMA (gold line on chart).
- Ideally, you should close the long trade out once 10-14 bars have elapsed after trade entry. But this particular trade took a while to work, and the use of a mechanical bar count trade exit didn’t provide much profit. Therefore, the use of a trailing stop would have been wise, regardless of the number of bars that had elapsed. The 8-period EMA is a great trailing stop and would have allowed you to harvest the majority of the gains.
- Long trades tend to move slower than short trades, hence a longer time window needs to be utilized to max out potential gains. Remember that!
An Even Larger Winning Trade
The long trade depicted was indeed a giant winner, and the stop-loss was never in danger of being hit. Notice how the pullback into the cycle low (green circle) was weak in comparison to the subsequent rally into the ultimate cycle high (green arrow). Buying the first pullback into a cycle low after a confirmed bullish trend reversal is the lowest risk, highest reward trade in any market, in any time frame, and in every liquid cryptocurrency.
Key Takeaways:
- Always buy the first significant pullback into a cycle low after a confirmed bullish trend reversal.
- Place your stop loss just beyond the cycle low.
- As the trade moves in your favor, take partial profits as price extends well above key moving averages (the 18-period EMA depicted on the chart).
- The use of cycle bar counts and an 8-period EMA trailing stop can also help provide a rational basis for profit taking.
- Long winning trades generally take longer to play out than short winning trades.
Summary
You now possess a working knowledge of how to use a low risk, high reward cycles trading strategy. So go further. Calculate the average cycle lengths in the crypto markets you trade and begin to develop your trading edge. Experiment with different oscillator settings and moving averages to fine-tune your strategy for trade entry and management. Begin working with these chart dynamics on your favorite coins today and see the crypto markets in a new light.
Disclaimer: Speculation in the cryptocurrency or other financial markets involves substantial risk; you should only use risk capital when trading. You should consult your licensed financial advisor before deploying risk capital in the financial markets.
Never Miss Another Opportunity! Get hand selected news & info from our Crypto Experts so you can make educated, informed decisions that directly affect your crypto profits. Subscribe to CoinCentral free newsletter now.


