


 Price: ETH Drops Below Key Support and Analyst Calls a Move to $1,580 — What’s Next?")


TLDR
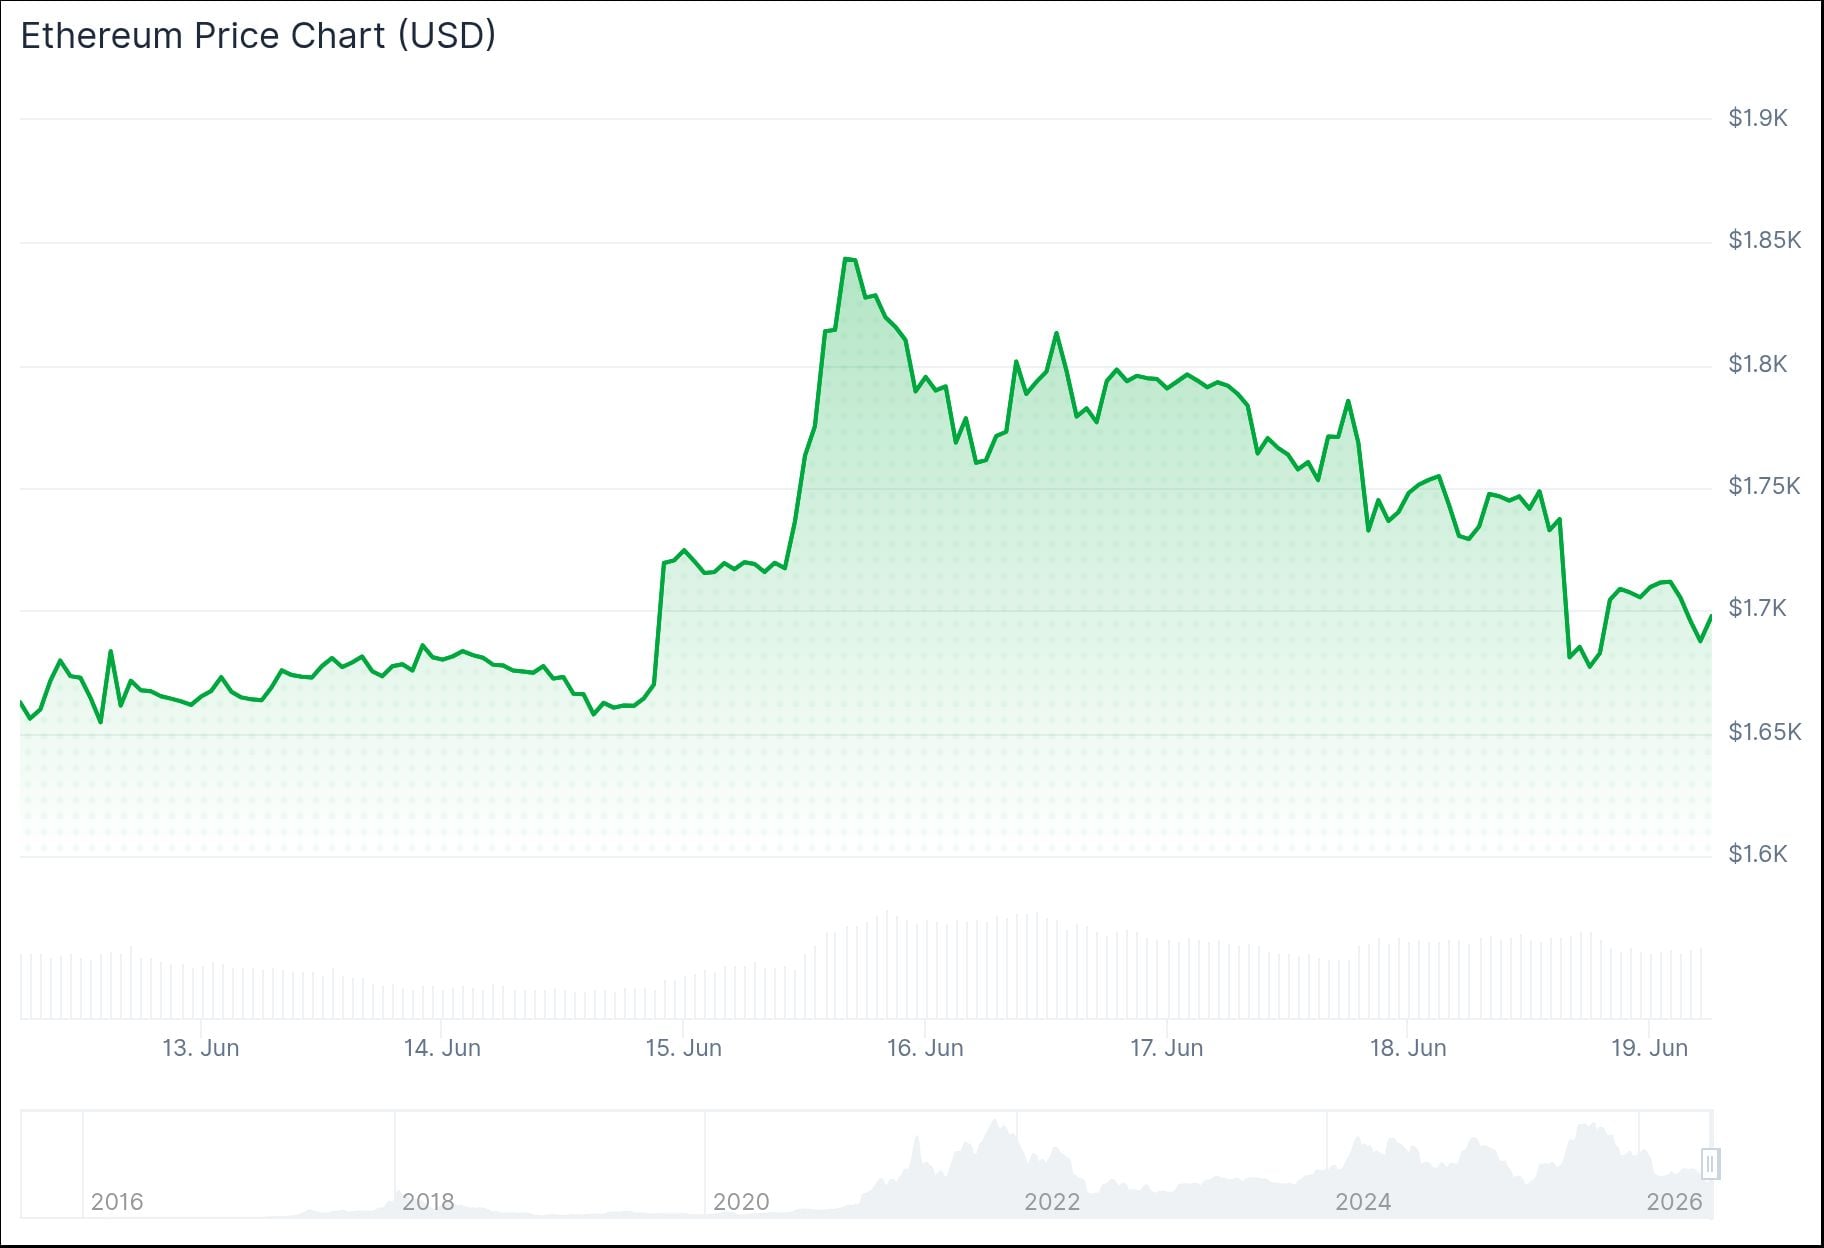
- ETH is trading around $1,682, down nearly 5% on the day, with price breaking below key trendline support.
- Network activity hit record highs in Q1 2026, with 13.2 million monthly active addresses and 200.4 million transactions.
- Tokenized commodities on Ethereum grew 60% quarter-over-quarter, led almost entirely by Gold.
- Derivatives activity has dried up, with options open interest falling to $5.5 billion from a $8.5 billion peak.
- ETH is coiled between $1,500 support and $1,920 resistance, with volatility compressing again.
Ethereum is trading around $1,682 after dropping nearly 5% in a single day. The price broke below a key ascending trendline, and the next major support level sits near $1,500.
The daily chart shows volatility squeezing again after a sharp sell-off in early June. That same pattern appeared before the previous big move lower.
Crypto analyst Ali Charts posted on X: “Ethereum $ETH is breaking down from its channel and is now trading below the 200-hour SMA. I’m expecting a move toward $1,580.” That call aligns with the current bearish chart structure, where ETH is stuck below the $1,750 resistance level after a brief bounce from the $1,500 floor.
Ethereum $ETH is breaking down from its channel and is now trading below the 200-hour SMA.
I’m expecting a move toward $1,580. pic.twitter.com/bri8017ic1
— Ali Charts (@alicharts) June 18, 2026
ETH lost two key support levels in recent weeks. It broke an ascending trendline and the $2,150 level in mid-May, then dropped through the $1,920 support zone before buyers appeared around $1,500.
Since that low, ETH has bounced back to the lower band of a descending channel near $1,750. That level now acts as resistance rather than support.
Derivatives and ETF Flows Signal a Quiet Market
Ethereum options open interest has fallen to around $5.5 billion across all exchanges, well below the $8.5 billion highs seen in January and March. Perpetual funding rates have also flatlined near zero, suggesting neither bulls nor bears are in control.


Low open interest and neutral funding mean there is less leverage in the market. When a catalyst does arrive, the price could move sharply with little resistance in either direction.
Spot Ethereum ETF flows have also stabilized. After months of steady outflows, June saw a handful of small positive inflow days. The amounts are modest, but the shift from selling to mild buying is a change from recent months.
Ethereum Network Hit Records in Q1 Despite Price Drop
Despite the price weakness, Ethereum’s underlying network posted strong numbers in Q1 2026. Monthly active addresses averaged a record 13.2 million, up 53.5% from the prior quarter. Transaction counts reached 200.4 million, up 38% quarter-over-quarter.
Throughput hit a record 25.78 transactions per second. Fees, however, dropped 47.9% quarter-over-quarter following the Fusaka upgrade in December, which expanded data capacity.
Tokenized commodities on Ethereum grew 60% quarter-over-quarter to $4.7 billion, driven almost entirely by Gold. Ethereum holds an 84% share of tokenized commodities across the top five chains.
ETH’s fully diluted market cap fell to $290 billion in Q1, down 30.3% quarter-over-quarter. The Relative Strength Index on the daily chart sits near 38, pointing to weak but stabilizing downside momentum.


