


On April 6th, the ICO review site ICObench published their ICO Market Review for the month of March alongside some fascinating industry data. It includes data on the different ICO platforms, overall market trends, stats by industry, and much more.
We read through the report and compiled some of the most interesting insights here. Read on to learn about the state of ICOs so far and where this new form of crowdfunding may be heading next.
The United States is dominating the ICO market, but smaller countries are making a splash too.
With 415 ICOs, the United States has nearly double the number of ICOs as the number 2 and 3 spots, Russia (238) and the United Kingdom (221). Singapore and Switzerland are the only other two countries in the triple digits with 187 and 123 ICOs, respectively.
Switzerland is in fourth place in terms of the number of ICOs, but second when it comes to the total funds they’ve raised. The country is just one of two to receive over $1 billion in contributions – the other being the United States. Due to the government’s openness toward blockchain technology, Zug, Switzerland (AKA Crypto Valley) has quickly become a crypto capital. It’s likely that the country will continue to see further ICO success.
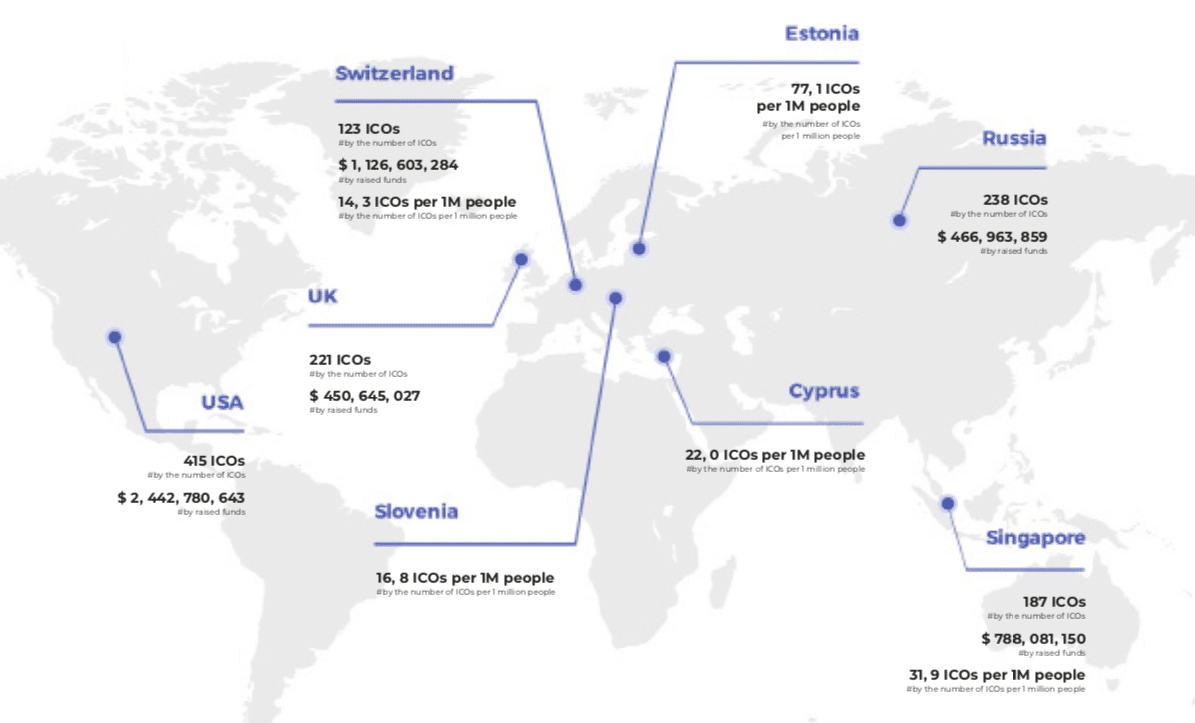
Most surprising here, though, is the impact that smaller nations are having on the ICO market. Estonia is producing a whopping 77.1 ICOs per 1 million citizens while Singapore boasts 31.9 per 1 million. Comparing this with the United States’ ratio of just a little over 1 ICO per 1 million citizens, it’s clear that these nations are looking to make a name for themselves in the blockchain world.
Ethereum is by far the preferred ICO platform.
Ethereum holds an 81.14% market dominance in relation to other ICO platforms. The next platform on the list, Waves, sits at just over 3%. Judging by the size of the Ethereum development community and reputation of the network, it wouldn’t be surprising to see the platform maintain its dominance.

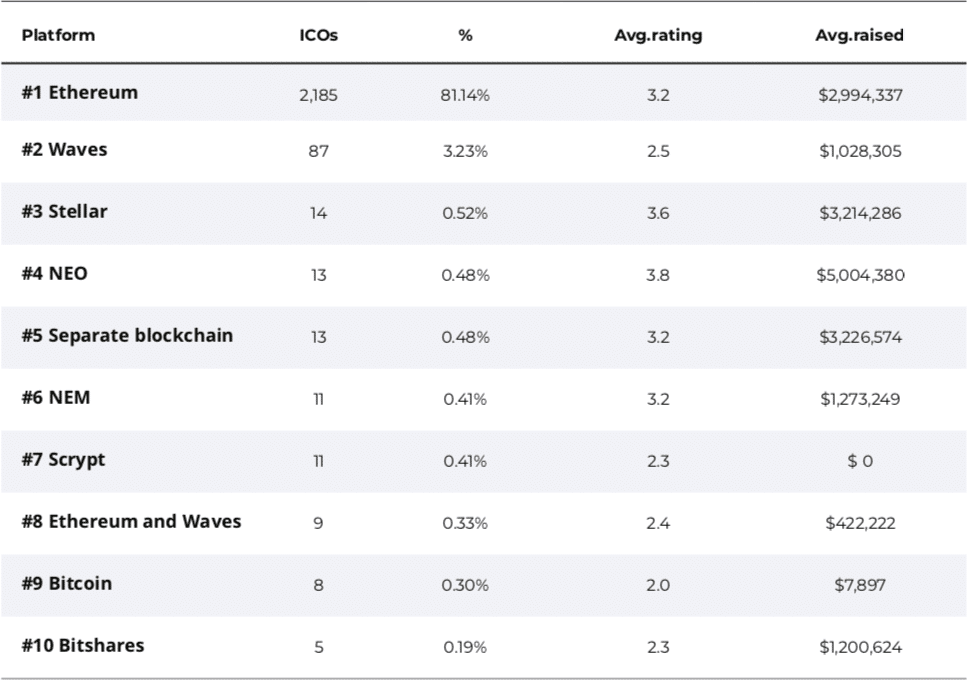
Although NEO has hosted just 14 ICOs, it leads the pack in the number of funds raised for each one. On average, each of the NEO ICOs has raised over $5 million. The next largest platforms in this respect are Stellar and projects that have built their own blockchain with an average raise of just over $3 million per ICO.
Another stat in NEO’s favor is the average score that its ICOs receive. NEO-based projects have the highest rating of all the platforms. This may be due to the high GAS cost associated with executing a NEO smart contract. This cost tends to weed out many of the less reputable projects found on other networks.
The ICO bubble may have popped.
Even though the number of ICOs is at an all-time high, the amount that they’re raising is at the lowest it’s ever been. The overall market average is at $1.8 million – just 10% of the September high.
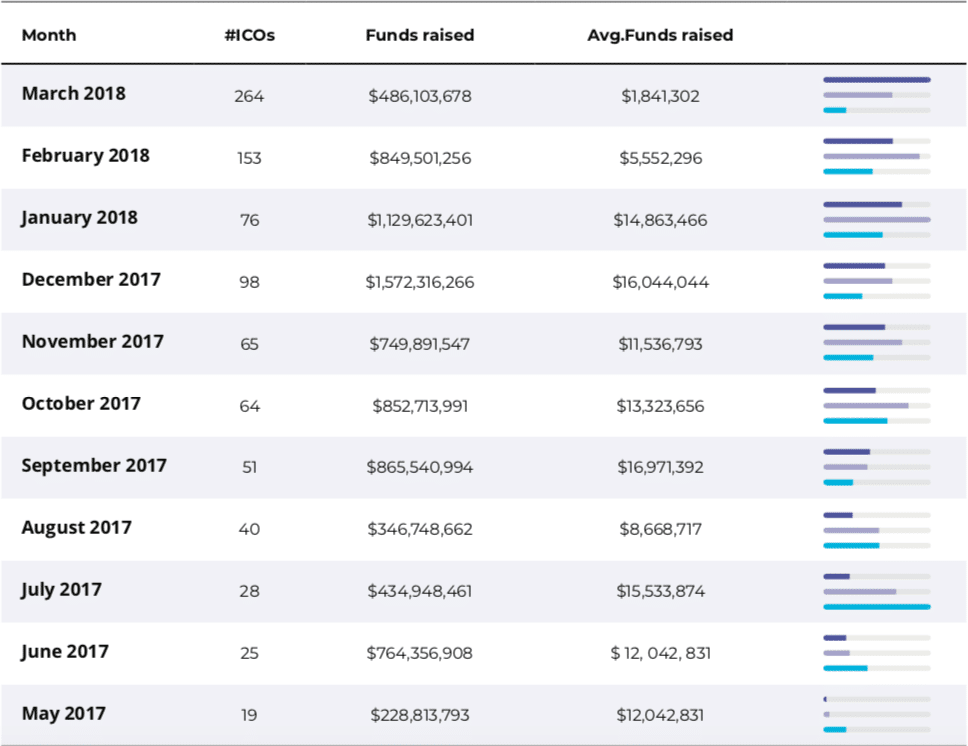
Looking at only March, the trend still remains. The number of ICOs increased each week while what they raise continues to drop lower. In the last week of March, the average funding of an ICO sat at a measly $348,400.
There may have been a few things that caused this downtrend. The decline of the entire cryptocurrency market most likely had the largest effect on the amount that ICOs could raise. On top of that, numerous exit scams and shady projects have had a lasting effect on the community. Potential investors are now more hesitant to put money towards an ICO, instead choosing to wait until the coin hits popular exchanges to buy it.
But, investing in ICOs could still be a lucrative business.
If you would have invested just $1000 into NEO (Antshares at the time) during its ICO, you would have over $1.5 million today. That’s about a 160,000% return over 7 months. Let that sink in for a moment. Even the 10th most successful ICO, Golem, has brought a return on investment (ROI) of ~2,000% in the past year and a half.
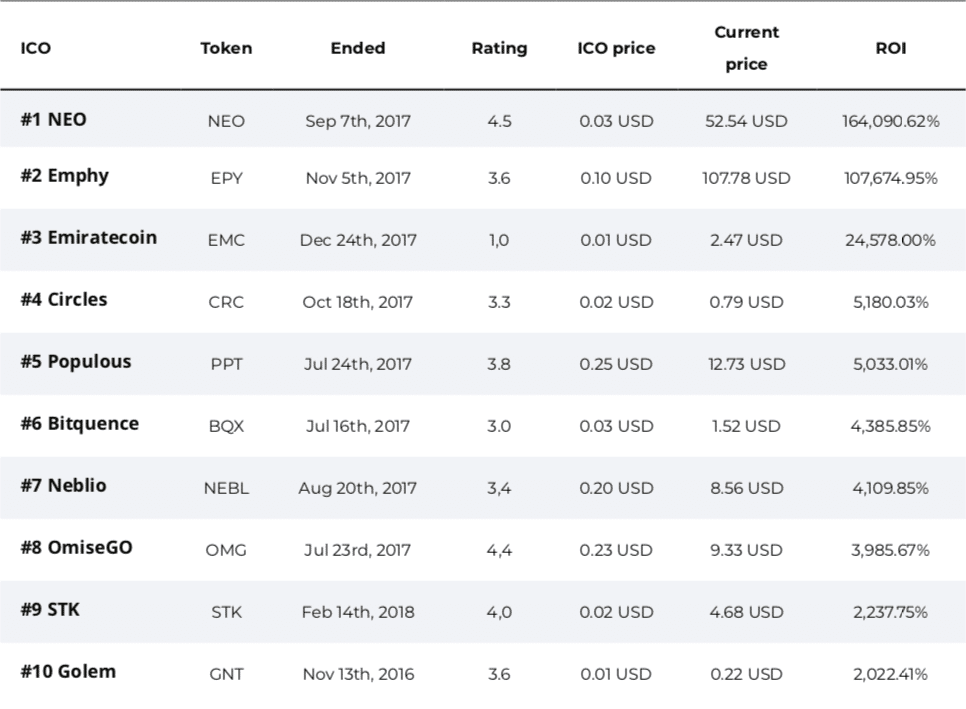
To put this into perspective, if you invested in the top performing stock of the S&P 500 last year, you would’ve received just a 132% return.
With the downturn in ICO investments, it’s hard to tell if there’s a greater opportunity now that projects are pricing coins lower during crowd sales or if the interest just isn’t enough anymore to bring the previously high gains.
What’s in store for ICOs?
As the market seems to be turning around, it’ll be interesting to see how ICOs react. A significant bull run could cause another wave of FOMO-induced mania in the ICO world. But, it’s entirely possible that the opportunities of 2017 were a one-time opportunity.
While the average amount raised by each project has significantly dropped, the number of them choosing to raise funds in this manner hasn’t stopped growing. It’s safe to say that from a start-up funding perspective, ICOs aren’t going anywhere anytime soon.
As always, the recommended path forward is for you to: do your own research, don’t invest more than you can lose, and hang on for dear life. Happy (ICO) hunting!
[thrive_leads id=’5219′]


