






TLDR
- HYPE is trading around $60.40, pressing against the $64 resistance level inside a falling wedge pattern
- Open Interest has hit a record $5.7 billion, showing growing derivatives participation
- Weekly active users have dropped from 190,000 in June to around 149,600
- A close above $64 could open the door to a move toward $72
- The 100-day EMA near $57.5 is acting as key support for bulls
Hyperliquid’s native token HYPE is trading around $60.40 after weeks of corrective price action. The token has been forming a falling wedge pattern, which is typically associated with a bullish reversal when buyers start to regain control.
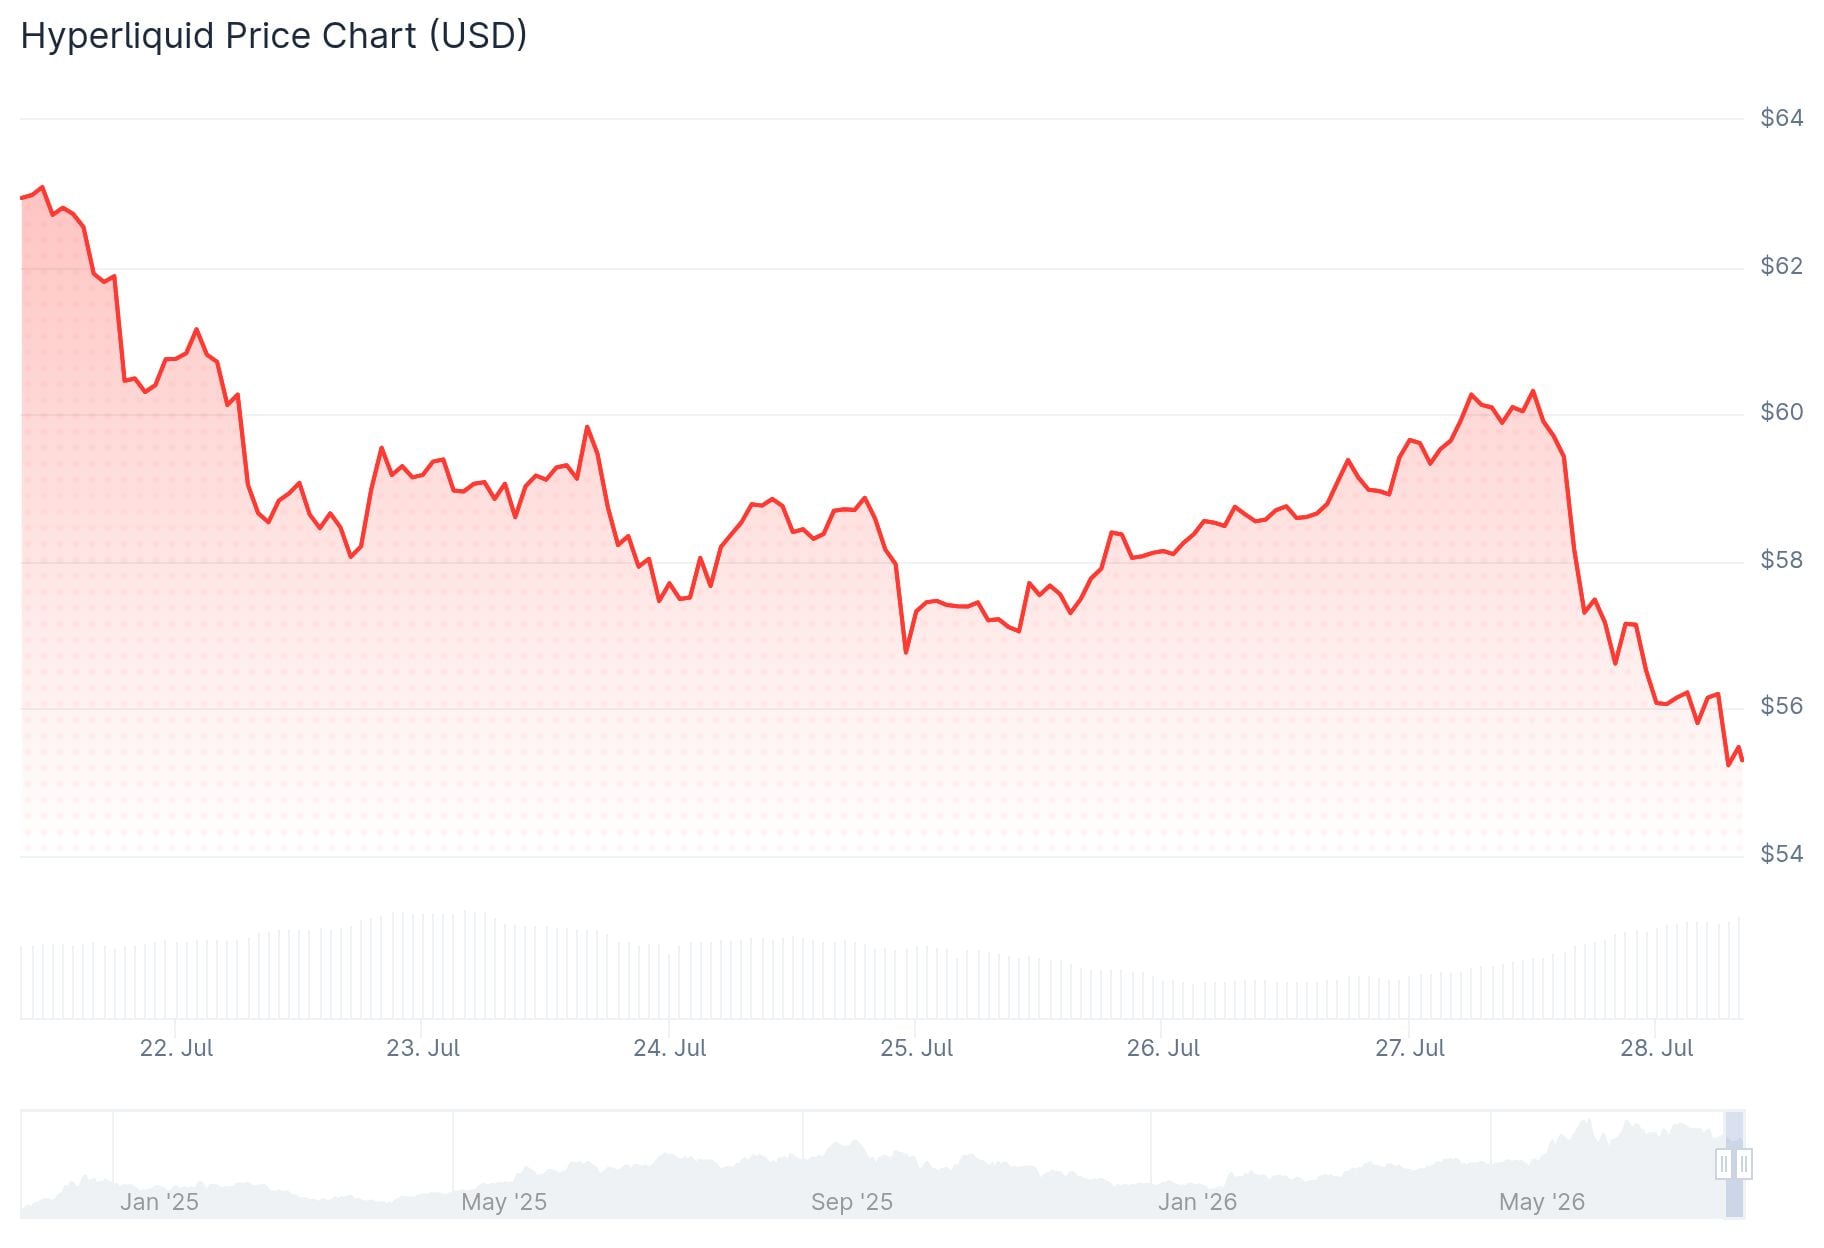
After rallying to nearly $72, HYPE pulled back and has been carving out lower highs while holding support in the $56–57 range. The key level to watch now is $64, which has rejected buyers multiple times over the past month.
The RSI has recovered to around 45 after dipping close to oversold territory. The MACD histogram is also shrinking, which suggests that bearish momentum is easing. A bullish crossover has not yet formed, so confirmation is still needed.
If buyers can push HYPE above $64 on strong volume, the next upside target would be the $72 area where the token previously saw heavy selling pressure. A failure to break above $64 could keep the token stuck in consolidation.
Derivatives Rising While User Activity Slows
Open Interest on Hyperliquid has climbed to a record $5.7 billion. This shows that traders are putting more capital into perpetual futures on the platform.
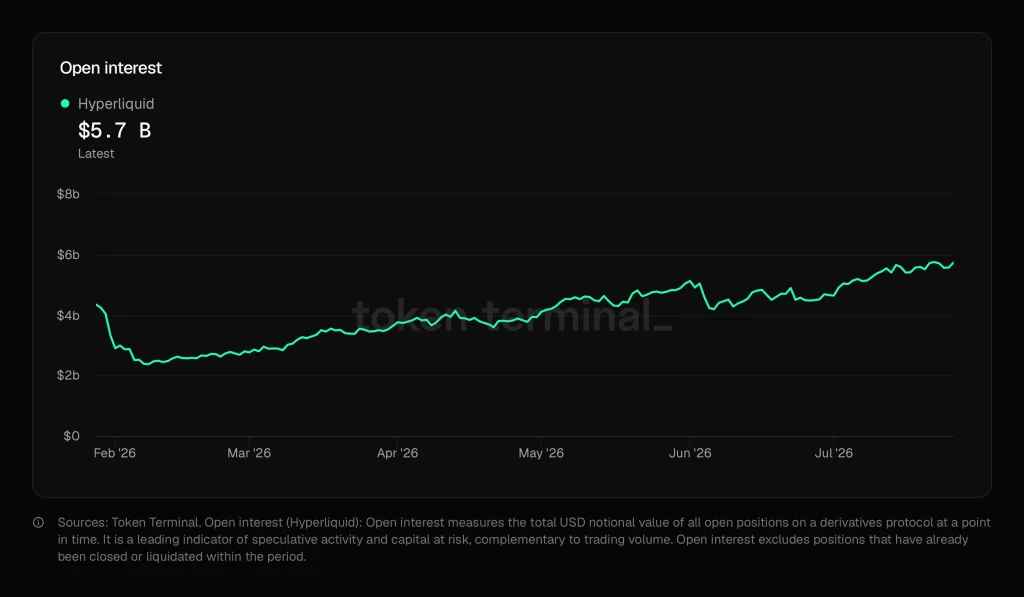
However, weekly active users have fallen from nearly 190,000 in early June to around 149,600. That drop suggests retail participation has slowed since the platform’s earlier surge.
This gap between rising derivatives activity and falling user numbers is worth watching. If leverage keeps building while on-chain engagement stays weak, HYPE could be more exposed to sharp moves around key resistance levels.

Key Support Levels to Watch
HYPE is currently sitting right on top of the 100-day exponential moving average at around $57.5. This level has held as support throughout the broader uptrend.
If that level breaks, the next support would be the 200-day EMA near $50. Losing the 100-day EMA would also break the medium-term bullish structure that has been in place since March.
Volume has been declining throughout the correction, which analysts read as a sign of profit-taking rather than aggressive selling. The RSI sitting at 43 also leaves room for buyers to build momentum without immediately hitting overbought territory.
$HYPE looks lame in the short term but I still think mid $50s all the way down to mid $40s would be an excellent buying opportunity. I still think it probably goes to $100 eventually pic.twitter.com/yDZFNstvsb
— Altcoin Sherpa (@AltcoinSherpa) July 27, 2026
Crypto analyst Altcoin Sherpa noted on X that while HYPE looks weak in the short term, a dip to the mid-$50s or even mid-$40s would be a strong buying opportunity. He added that he still believes HYPE could reach $100 eventually.
HYPE is currently trading at $60.40, sitting just below the 26-day EMA at $62 and the 50-day EMA at $64.3.


