


What are Continuation Chart Patterns?
Forming a major component of technical analysis, continuation chart patterns assist investors in forecasting the future price movement of an asset. Whether you plan to invest in Bitcoin or Ethereum, continuation chart patterns create powerful buy and sell signals that can help you better time your investment decisions.
Continuation Chart Patterns Overview
In short, continuation chart patterns indicate that the prevailing price trend of a security is likely to continue following the pattern’s completion. For example, if an asset is currently in the middle of a price downtrend, the formation of a continuation trading pattern would signal the likely continuation of the current downtrend following the pattern’s completion.
Continuation Chart Patterns That We’ll Cover:
- Bullish Rectangle
- Bearish Rectangle
- Ascending Triangle
- Descending Triangle
- Bullish Flag
- Bearish Flag
[thrive_leads id=’5219′]
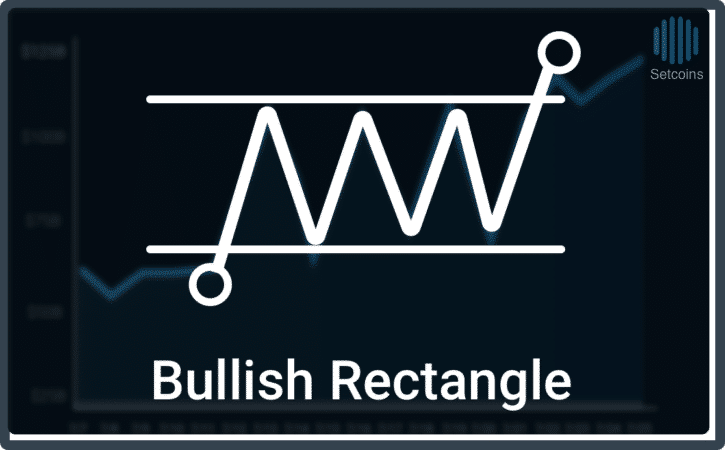
Bullish Rectangle
The Bullish Rectangle is a continuation pattern depicted by temporary sideways price movement between two horizontal trendlines during a strong uptrend. In this formation, the asset’s price bounces between the two parallel trend lines before the overall uptrend continues.
To be properly defined as Bullish Rectangle, the price should touch each trendline at least twice with two different valleys and peaks before it breaks the top trendline of resistance. Once the price of the asset closes above the upper trendline, the investor should buy the asset or enter a long position.
Bullish Rectangle Pattern Summary:

- Bullish/Bearish – Bullish
- Pattern’s Preceding Price Trend – Upward
- Confirmation Signal – When the price closes above the upper trendline.
- Pattern Price Target = Top Trend Line + (Top Trend Line – Bottom Trend Line)
- Percentage of Time Pattern Hits Price Target – 80%
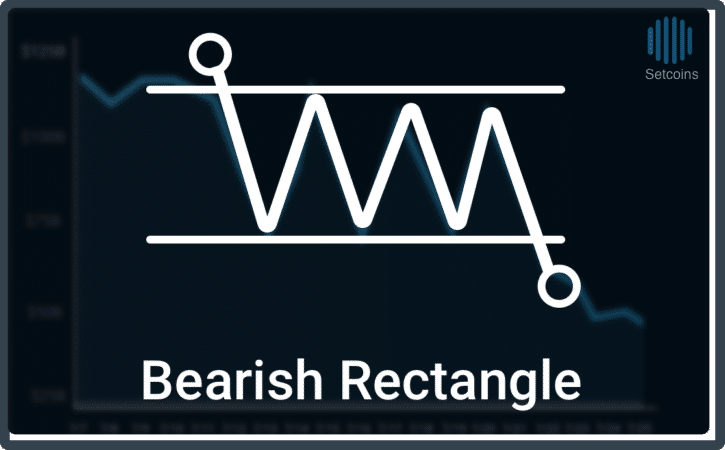
Bearish Rectangle
The Bearish Rectangle is a continuation pattern depicted by temporary sideways price movement between two horizontal trendlines during a strong downtrend. In this formation, the asset’s price bounces between two parallel trend lines before the overall downtrend continues.
To be properly defined as Bearish Rectangle, the price should touch each trendline at least twice with two different valleys and peaks before it drops below the bottom trendline. Once the price of the asset closes below the bottom trendline of support, the investor should either sell the asset or enter a short position.
Bearish Rectangle Pattern Summary:
- Bullish/Bearish- Bearish
- Pattern’s Preceding Price Trend- Downward
- Confirmation Signal- When the price closes below the lower trendline.
- Pattern Price Target- Lower Trendline – (Upper Trendline – Lower Trendline)
- Percentage of Time Pattern Hits Price Target- 50%
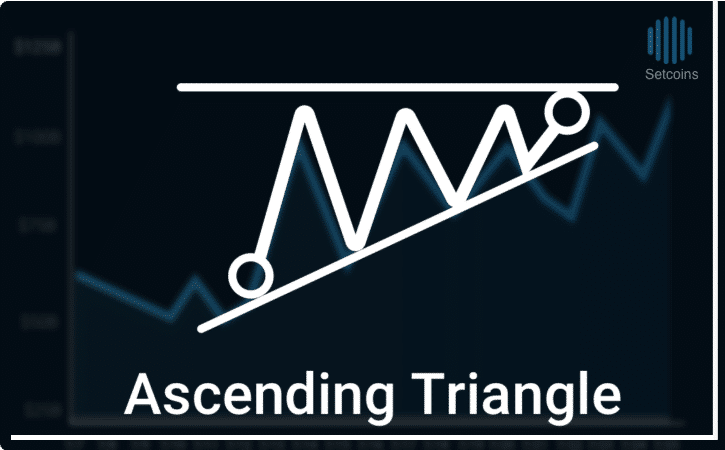
Ascending Triangle
The Ascending Triangle is a bullish continuation pattern depicted by the formation of a right triangle created by two trend lines. The top trend line is drawn horizontally at a level where resistance has prevented the price from breaking through while the bottom trendline connects a series of troughs. Once the price surpasses the top trend line, upward price momentum is expected to continue.
The Ascending Triangle usually forms during an uptrend as a continuation pattern but it can also form as a reversal pattern at the end of a downtrend. The Ascending Triangle pattern depicts that the demand for an asset is increasing over time.
Ascending Triangle Pattern Summary:
- Bullish/Bearish – Bullish
- Pattern’s Preceding Price Trend – Either Downward or Upward
- Confirmation Signal – Price closes above the upward trend line
- Pattern Price Target – Pattern High + ( Pattern High – Pattern Low)
- Percentage of Time Pattern Hits Price Target – 75%
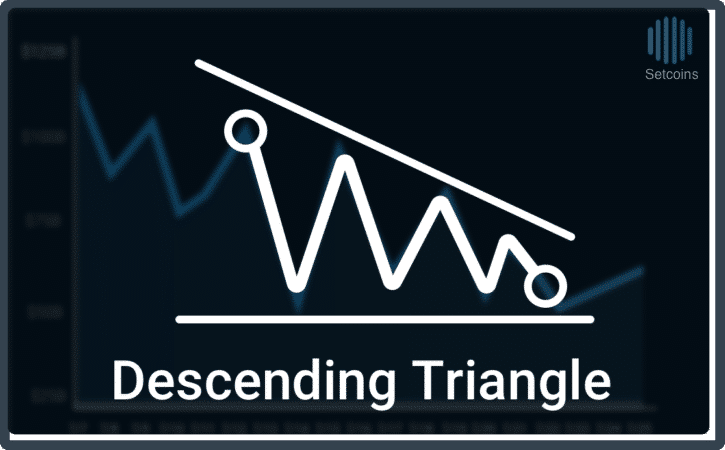
Descending Triangle
The Descending Triangle is a bearish continuation pattern depicted by the formation of a right triangle created by two trend lines. The top trendline connects a series of descending highs while the lower trend line is drawn horizontally at a level of consistent lows. Once the price decreases below the lower trend line, downward momentum is expected to continue.
The Descending Triangle pattern usually forms during a downtrend as a continuation pattern but it can also form as a reversal pattern at the end of an uptrend. The Descending Triangle pattern depicts that demand for an asset is weakening over time.
Descending Triangle Pattern Summary:
- Bullish/Bearish – Bearish
- Pattern’s Preceding Price Trend – Either Downward or Upward
- Confirmation Signal – Price closes below the lower trendline.
- Pattern Price Target – Pattern Low – ( Pattern High – Pattern Low)
- Percentage of Time Pattern Hits Price Target – 54%
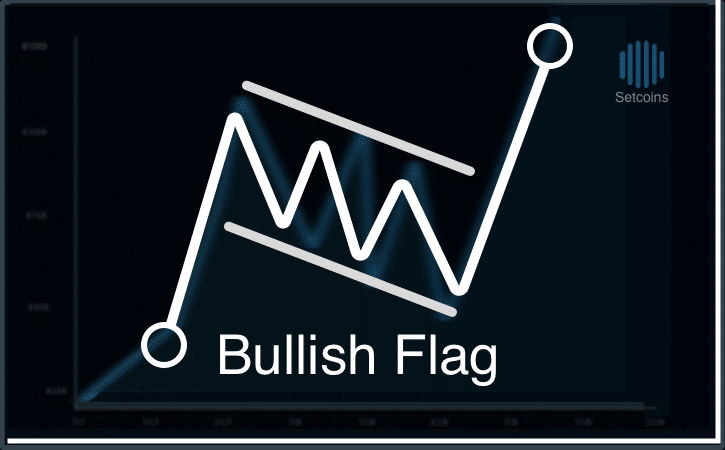
Bullish Flag
Resembling a flag at the top of a pole, the Bullish Flag is a short-term continuation pattern that signals an area of temporary market consolidation before the prevailing uptrend continues. In the Bullish Flag pattern, the flag’s pole is created by a sudden vertical rise in the price of the asset while the flag is normally created by the area of temporary downward consolidation against the prevailing uptrend trend.
In the Bullish Flag, the flag is usually angled downward away from the prevailing trend but it can also form angled up. The pattern is completed once the price of asset breaks firmly through the upper trendline of resistance. The pattern’s price target is measured by adding the length of the pattern’s flagpole to the price associated with the bottom of the flag.
- Bullish/Bearish – Bullish
- Pattern’s Preceding Price Trend – Upward
- Confirmation Signal – When price closes above upper trendline.
- Pattern Price Target = Lowpoint of the Flag + Flagpole height
- Percentage of Time Pattern Hits Price Target – 64%
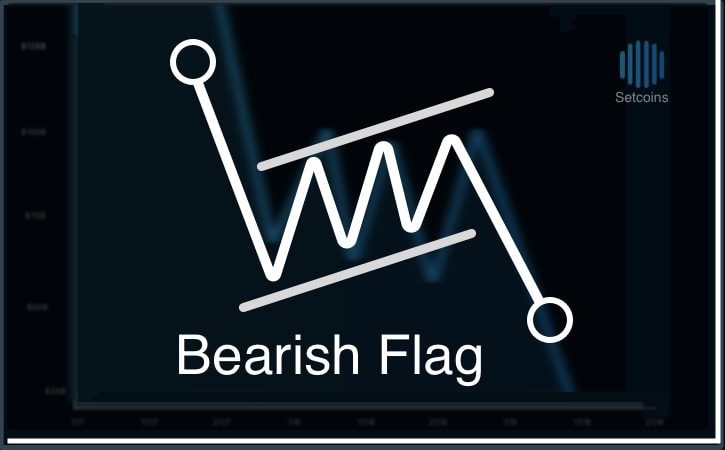
Bearish Flag
Resembling a flag at the bottom of a pole, the Bearish Flag is a short-term continuation pattern that signals an area of temporary market consolidation before the prevailing downtrend continues. In the Bearish Flag pattern, the flag’s pole is created by a sudden drop in the price the price of the asset while the flag is normally created by the area of temporary upward consolidation against the prevailing downtrend.
In the Bearish Flag, the flag is normally usually upward away from the prevailing downtrend trend but it can also form angled up. The pattern is completed once the price of asset breaks firmly below the bottom trendline of resistance. The pattern’s price target is measured by subtracting the length of the pattern’s flagpole from the price associated with the top of the flag.
Bearish Flag Pattern Summary:
- Bullish/Bearish – Bearish
- Pattern’s Preceding Price Trend – Downward
- Confirmation Signal – When price closes below lower trendline.
- Pattern Price Target = Highpoint of the Flag – Flagpoint height
- Percentage of Time Pattern Hits Price Target – 47%
Conclusion
Providing powerful cues about an asset’s future price movement, continuation chart patterns are an important evaluation tool that can help you determine when to divest or invest in an investment after you first completing fundamental analysis of the security.
Liked this quick introduction to continuation chart patterns? Check out our guide to reversal chart patterns.


