






TLDR
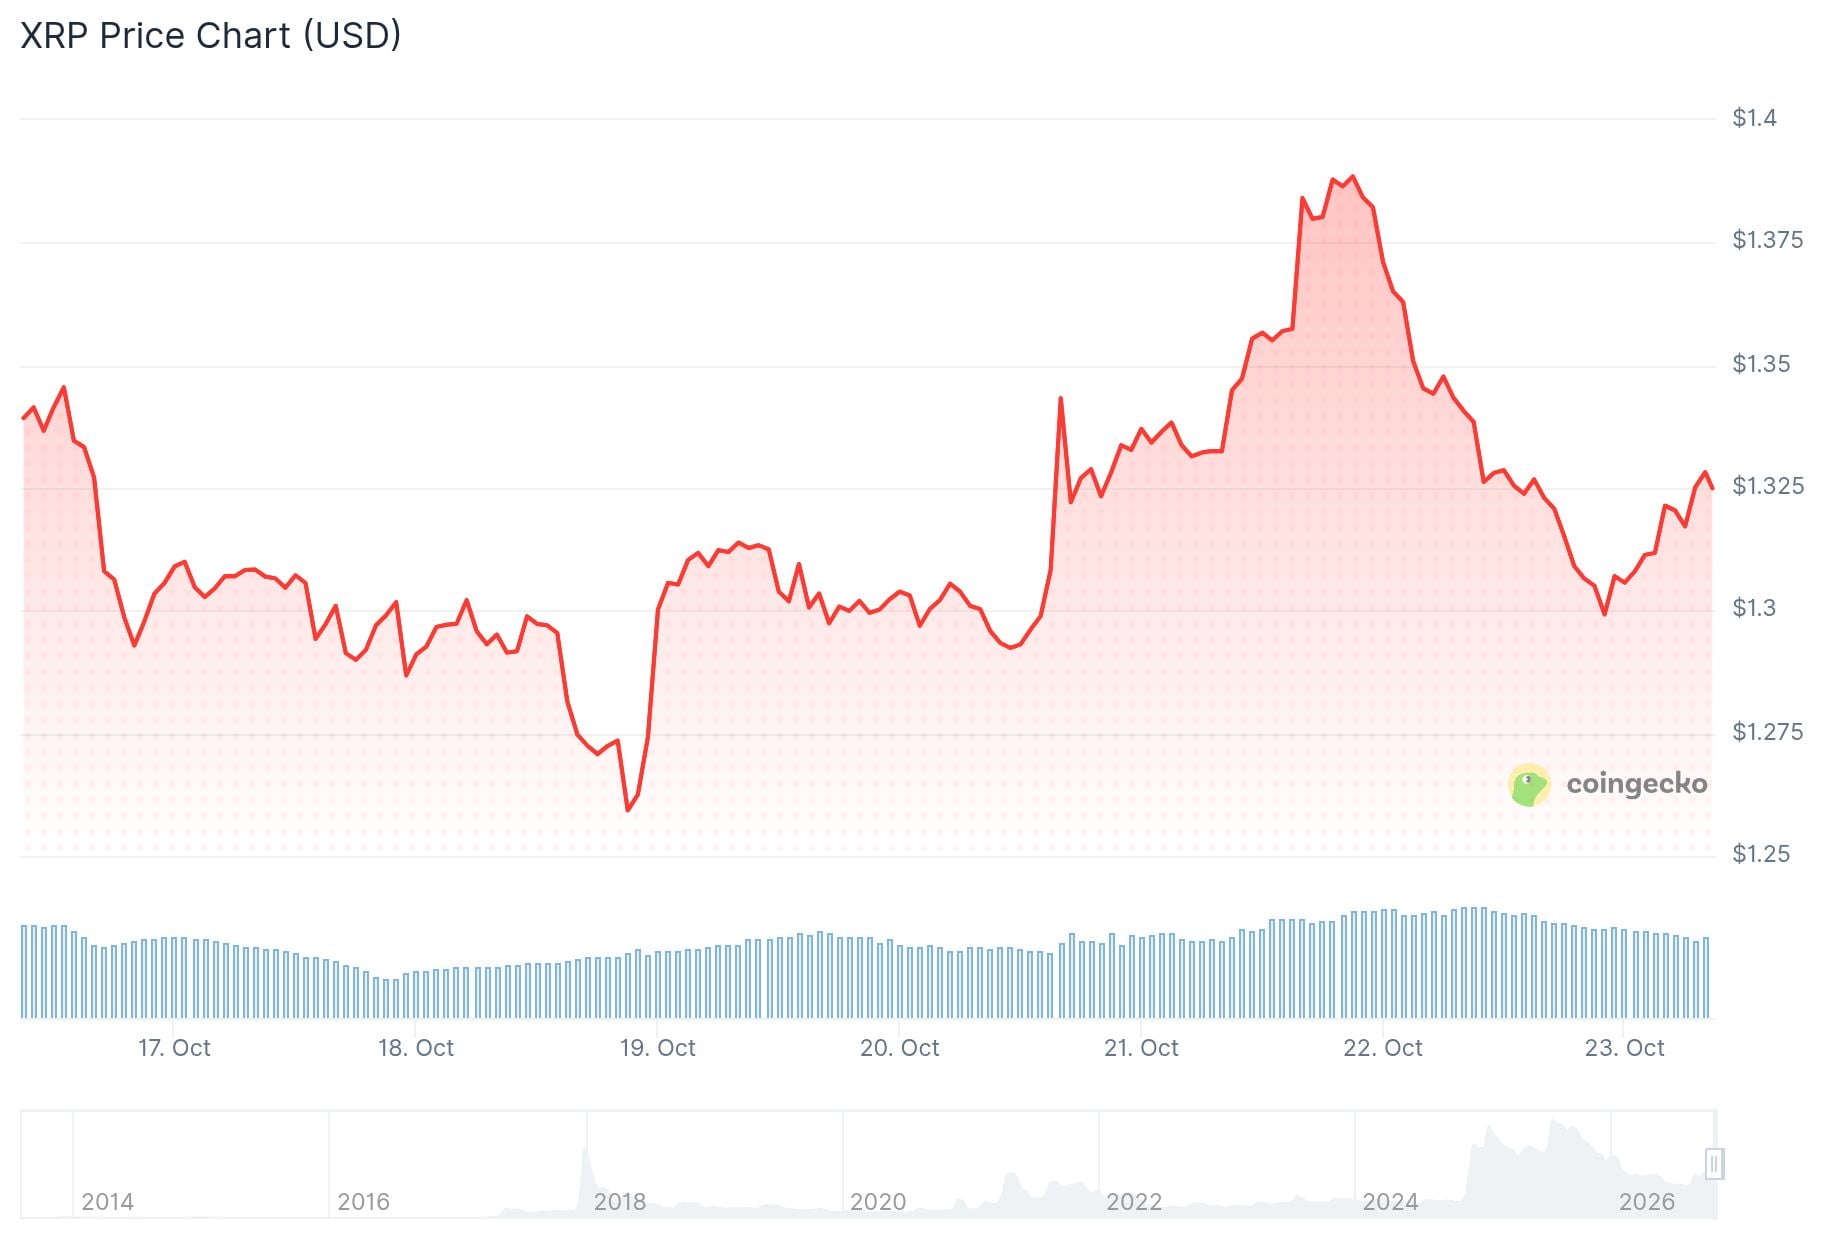
- XRP is trading near $1.33 after a failed push toward $1.40, with the $1.30 support area in focus.
- The XRP Ledger bug fix is delayed to November after validator support fell to 26 from 35.
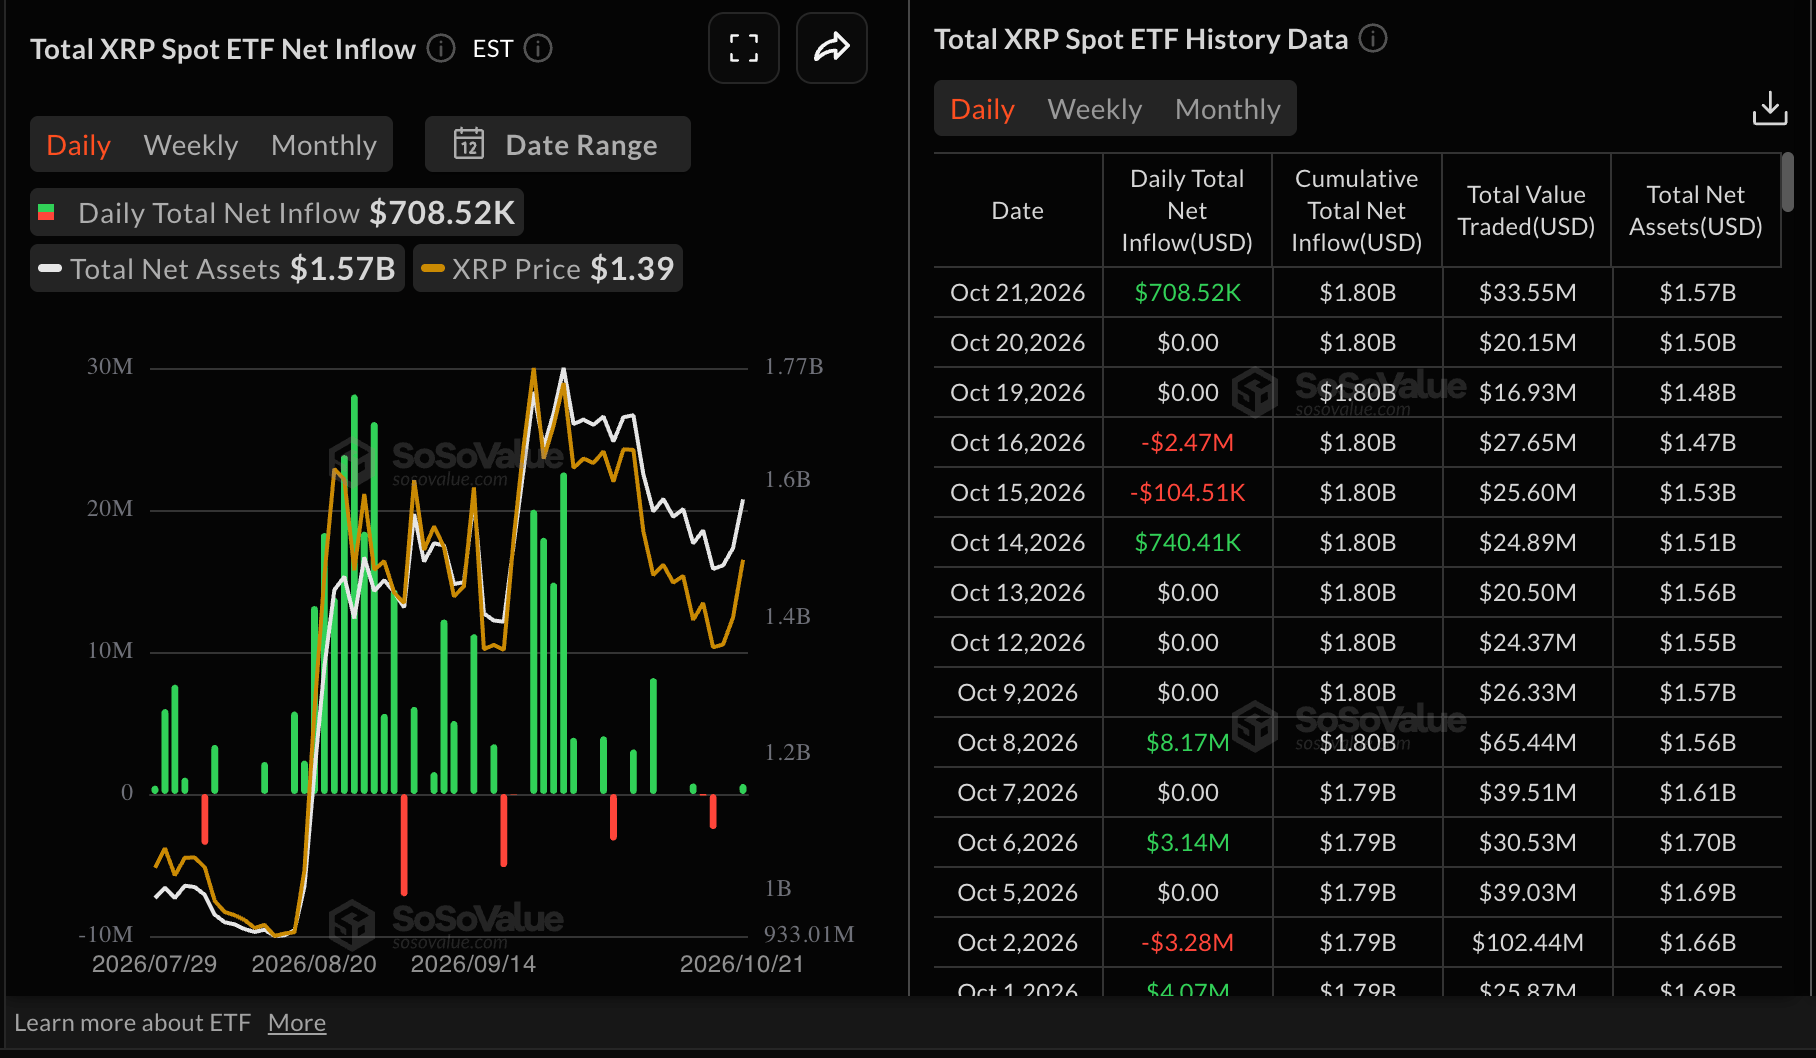
- US spot XRP ETFs took in about $709,000 on Wednesday, with cumulative inflows at $1.8 billion.
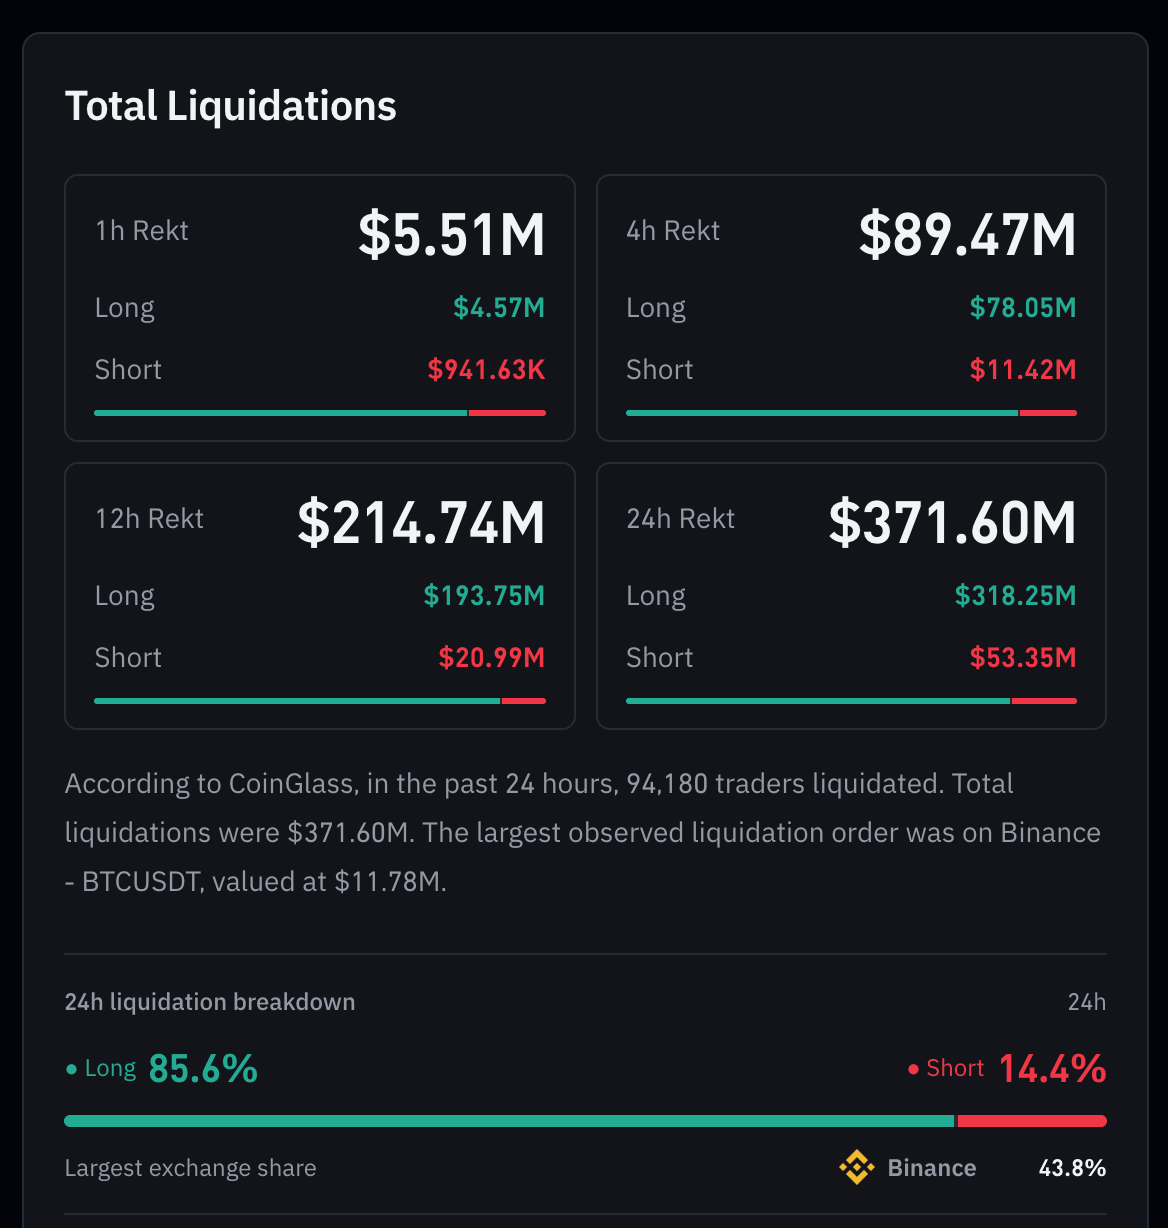
- Over $300 million in long positions were liquidated in 24 hours, and the long-to-short ratio fell to 0.71.
- Resistance sits at $1.34 and $1.38, while support levels are $1.26 and $0.94.
XRP is sliding toward $1.30 on Thursday, giving back gains from earlier in the week. The token traded near $1.33 after buyers failed to hold a push toward $1.40.
The broader market is also lower. Bitcoin (BTC) slipped below $82,000, and Ethereum (ETH) fell to around $2,400.
US-listed XRP spot ETFs recorded about $709,000 in inflows on Wednesday, following two days of muted activity. Cumulative inflows stand at $1.8 billion, with net assets at $1.6 billion.
The XRP Ledger also delayed a scheduled bug fix. Validator support dropped to 26 from 35, and the patch now has to wait about two weeks, pushing it into November.
CoinDesk reported on X that validator support has since recovered to 31. XRPL amendments need over 80% approval, meaning at least 29 of 35 validators must back a change for 14 days.
Sellers Dominate the Charts
On Tuesday, XRP hit a sell wall at $1.39 and fell back to $1.31. That level had been flagged as a key pivot after a trend reversal.
The drop came at the 200-period EMA on the 4-hour chart, near $1.36. Order volume often builds up in such zones.

CoinGlass data shows more than $300 million in long positions were liquidated over 24 hours. The cause of the drop is unclear, according to analyst Alejandro Arrieche of FXEmpire.
The futures long-to-short ratio fell to 0.71, its second-lowest reading in about 45 days. On October 17, it hit 0.59, and XRP then dropped from $1.30 to $1.26.
Crypto analyst Sjuul of AltCryptoGems said on X that $XRP remains range-bound between its range high and low. He hopes price holds the range low, since a large zone with no support sits just below it and things could turn ugly if it breaks.
$XRP remains pretty much range-bound, bouncing between range high and range low.
Hopefully price keeps holding range low, because if it doesn’t, there’s a huge no-support zone just below it, and things could get pretty nasty. pic.twitter.com/Ud5XwSBuVV
— Sjuul | AltCryptoGems (@AltCryptoGems) October 22, 2026
On the daily chart, the 100-day EMA at $1.34 is the nearest cap. The 50-day and 200-day EMAs sit just above, near $1.37 to $1.38.
The RSI is near 43, and the MACD is slightly negative. A break above the EMA cluster would open the SuperTrend line near $1.47, with $1.62 and $1.70 beyond that.
If $1.31 gives way, the next targets are $1.29 and then $1.26. Losing $1.26 could bring a retest of the cycle lows between $1.10 and $1.00, and the weekly SuperTrend sits near $0.94.
On the weekly chart, the RSI is near 48 and the MACD histogram is positive but easing.
Chart Analysis
XRP looks stuck under a heavy stack of EMAs, and every bounce is running into sellers. RSI in the low 40s and a soft MACD say momentum favors the bears for now. The 100-day EMA at $1.34 is the first cap bulls need to flip.
Plenty of traders are eyeing that $1.31 to $1.30 zone as the line in the sand. Watch the $1.26 support next, because a clean break there opens the door to $1.10 and possibly $1.00.


