





TLDR
- SOL is trading around $77–$78, up nearly 30% from its June low of $60
- Key resistance sits between $89–$92; a breakout could open the door to $100
- SBI Holdings partnered with the Solana Foundation to build an on-chain financial market in Japan
- Solana processed over $4 billion in DEX volume in 24 hours, outpacing rival chains
- $74–$75 is the critical support zone; a break below could push SOL toward $68.57
Solana has staged a solid recovery over the past several weeks, climbing roughly 30% from its June low near $60. The token is now trading around $77–$78, holding above a key support zone that analysts are watching closely.
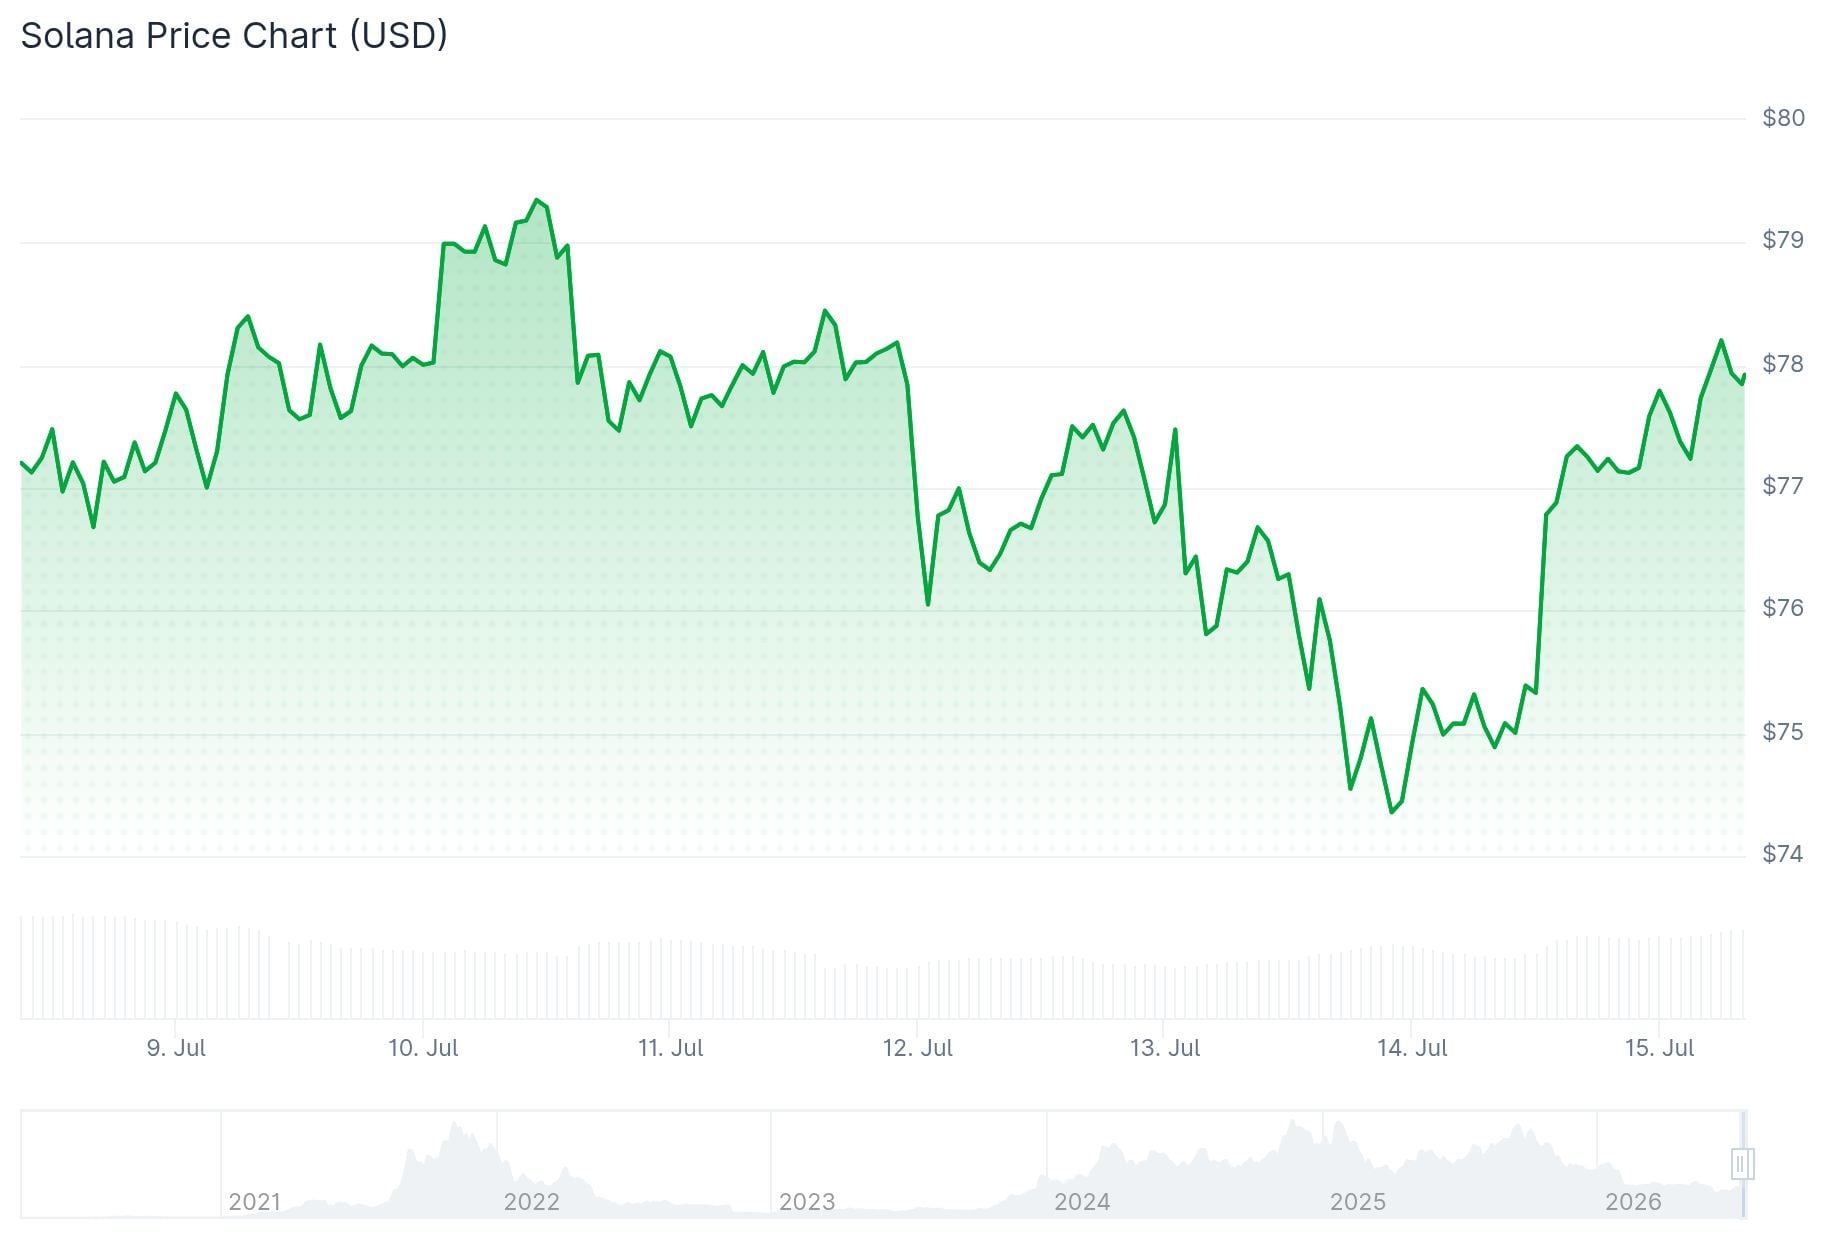
Daily trading volume reached $3.87 billion, with a market cap of around $44.79 billion according to CoinMarketCap. SOL is currently sitting near the middle Bollinger Band at $76.73, with the upper band at $84.89 and the lower band at $68.57.
The price is trading inside an ascending channel, forming higher highs and higher lows. This pattern suggests buyers are gradually taking control, though the rally has not yet cleared its next major hurdle.
Institutional Moves Supporting SOL
Japan’s SBI Holdings has partnered with the Solana Foundation to develop an on-chain financial market. The project will focus on stablecoins, tokenized real-world assets, and cross-border payments.
This partnership adds weight to Solana’s institutional adoption story and has contributed to improved sentiment around the token.
On-chain activity has backed up the bullish case. Solana processed more than $4 billion in decentralized exchange volume in a single 24-hour period, outperforming competing blockchains during that window.
Crypto analyst Ali Charts posted on X that Solana’s ATR trailing stop has flipped below price for the first time since October 10, triggering a SuperTrend buy signal. Ali Charts noted that if buying pressure continues, SOL could rally toward $96 or even $121, though $60 remains the level to watch — a break below would invalidate the bullish setup.

SOLANA TURNED BULLISH
The ATR trailing stop has flipped below price, marking the first SuperTrend buy signal since October 10.
If buying pressure continues to build, $SOL could rally toward $96 or even $121. However, $60 remains the key level to watch.
A break below that… https://t.co/Femtlawn2r pic.twitter.com/pJSFngWZiN
— Ali Charts (@alicharts) July 15, 2026
Key Levels to Watch
Analyst BitGuru flagged the $74–$75 range as a critical support zone on July 14. He noted that staying above this level could lead to a move toward $80–$84, while a failure would push SOL lower.
Most traders are bearish on $SOL but price is now testing a key support zone after a steady pullback.
As long as $74-$75 holds, I expect buyers to step in. A strong bounce from this level could send SOL back toward the $80-$84 resistance. pic.twitter.com/cDA9KiXGBP
— BitGuru 🔶 (@bitgu_ru) July 14, 2026
The MACD line sits at 0.9160, below the signal line of 1.2750, with a negative histogram of -0.3590. This indicates weakening momentum in the short term.
The bigger obstacle is the $89–$92 supply zone, which has rejected price multiple times since March. A confirmed breakout above $92 would put the $100 level directly in play.
SOL is currently trading at $77.01, up 1.74% in the past 24 hours.


