


 Price: SOL Is Back Near $90 — Will This Finally Be the Breakout?")


TLDR
- SOL is trading around $88–$90, a resistance level that has rejected the price multiple times since February.
- 24-hour trading volume jumped 35% to $5.3 billion, the highest weekly volumes since early March.
- Solana ETFs recorded inflows for 8 straight days, totaling $50 million, with assets under management at $863 million.
- A clean close above $95–$98 could open the path toward $105–$120; failure risks a drop back to $75–$77.
- Solana’s DeFi footprint remains small, with its largest protocol Kamino holding under $2 billion TVL compared to Ethereum’s Aave at $12.8 billion.
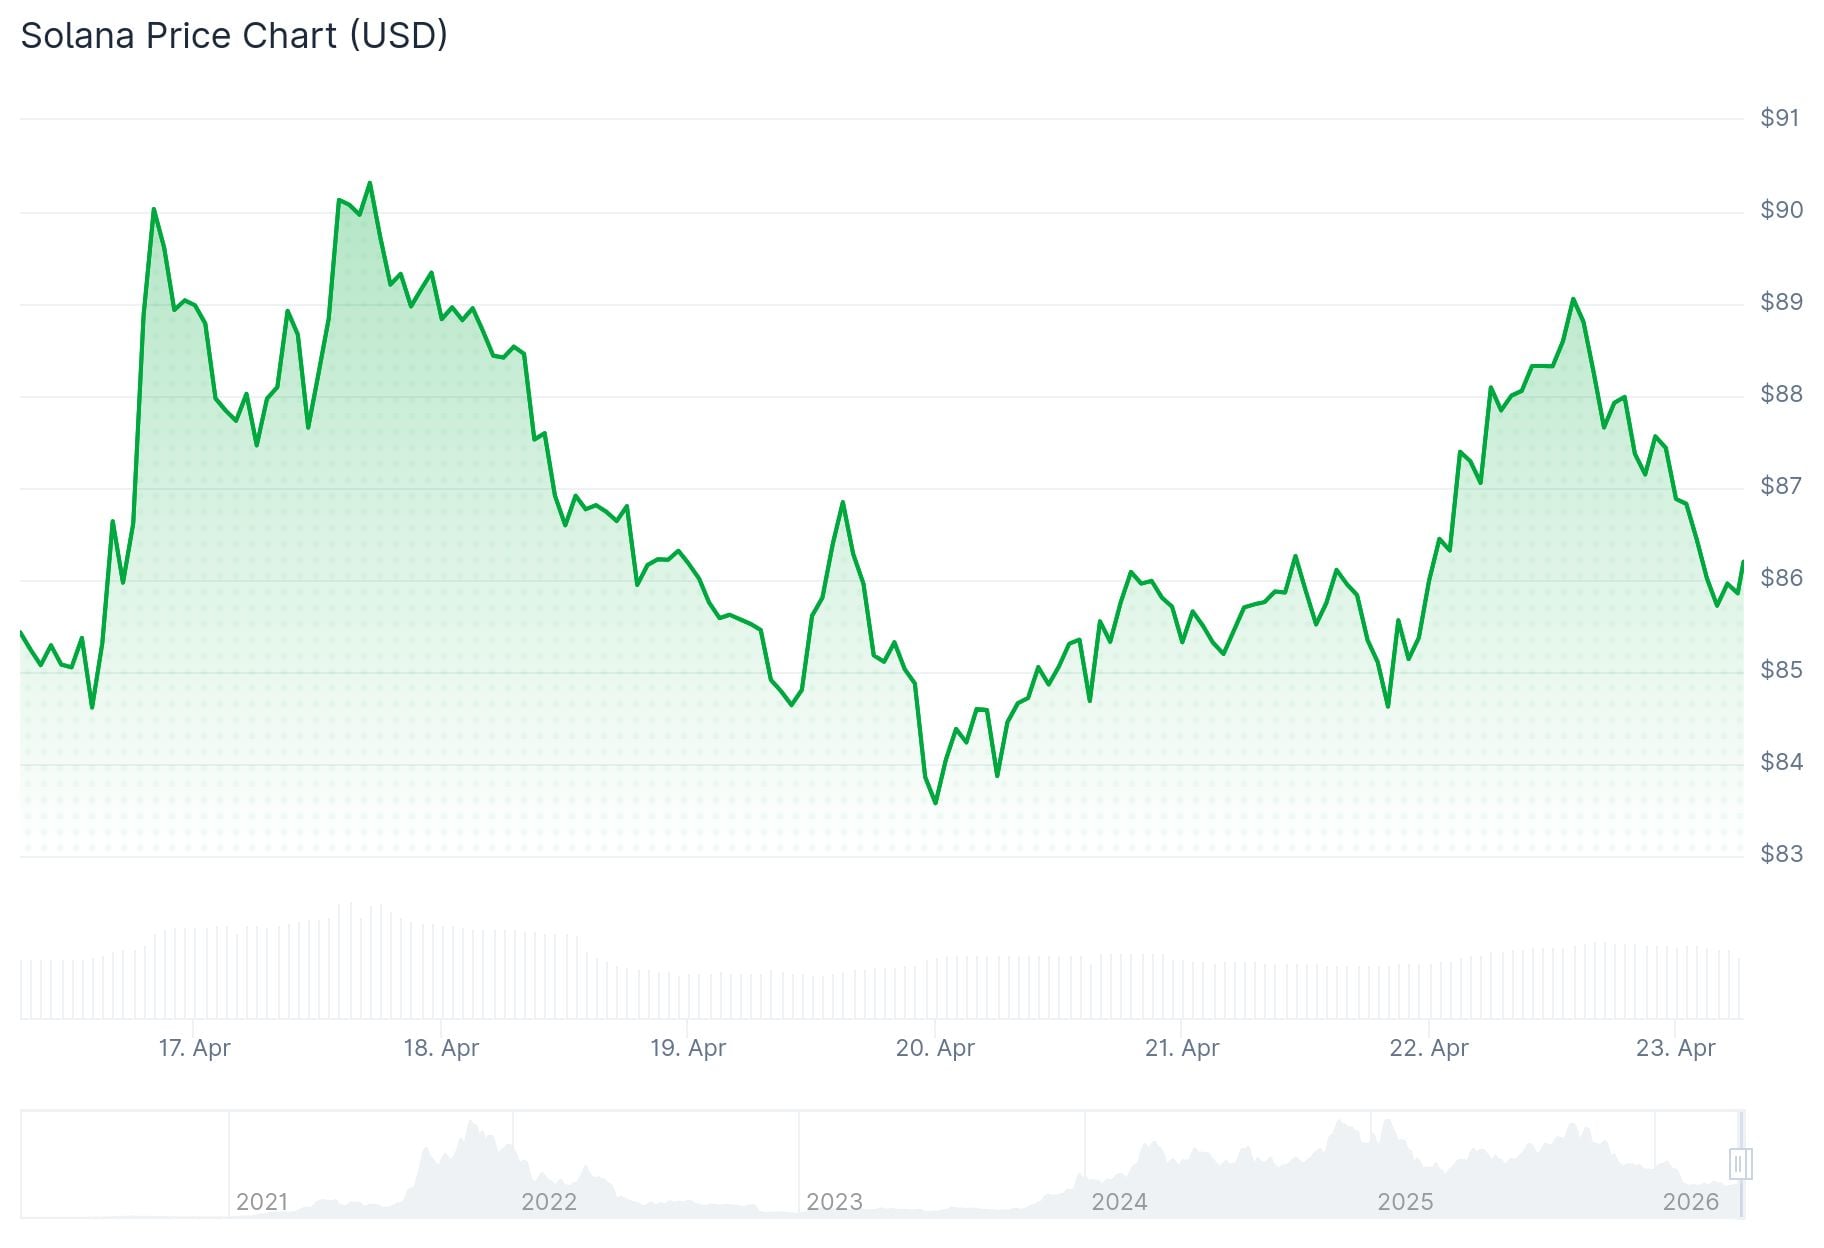
Solana (SOL) is once again testing the $90 resistance zone, a price level that has turned back buyers multiple times since February. The token is trading around $88, up roughly 2.5% in the last 24 hours, after reaching a high of $94.21 earlier in the current cycle before pulling back more than 5%.
In the past 30 days, SOL has lost about 2.4% while Bitcoin and Ethereum each gained around 12%. That gap in performance is drawing attention from traders and analysts watching closely to see if this attempt plays out differently.
Trading volume has picked up. In the last 24 hours, volume climbed 35% to $5.3 billion, which is close to 11% of SOL’s circulating market cap. According to data from Artemis, last week’s volumes were the highest since early March.

SOL has now been rejected at the $88–$90 supply zone multiple times. Each time, buyers have pushed into the zone and sellers have absorbed the move. Analysts note resistance clusters between $86 and $89, with a confirmed breakout requiring a daily close above $95–$98 on strong volume.
On the positive side, Solana ETFs have brought in inflows for eight consecutive days. Total inflows over that stretch reached $50 million, bringing total assets held in these funds to $863 million. That sustained buying from institutional-style vehicles is one signal that appetite for SOL has not disappeared.
Technical Picture
Analyst Lucky, posting on X, shared charts showing SOL compressing inside a descending channel while pressing against overhead resistance. The chart also shows a demand zone floored at $67.73. Lucky noted that a previous breakout from a similar structure produced a meaningful rally and suggests the same pattern may now be forming at a larger degree.
Look at $SOL… still glued to $85 like it signed a lease there.
How much longer is it planning to stay stuck? pic.twitter.com/5gkTMFfOhK
— Lucky (@LLuciano_BTC) April 21, 2026

Analyst MCO Global DE offers a different read, arguing the current bounce is still corrective and that the five-wave decline structure remains intact below $89. Two competing views, one price.
The Relative Strength Index is trending toward the mid-50s — building momentum, not yet overbought. MACD is also turning positive, showing a gradual shift toward buying pressure. Traders Union has forecast a price near $87.84 within the week, reflecting expectations of continued consolidation rather than a clean breakout.
If SOL does break and hold above $95–$98, analysts point to an initial move toward $105–$120. One analysis puts the upside at 36% from current levels if momentum builds toward the 200-day EMA. Deeper targets of $253 have also been noted on breakout charts if broader market conditions align.
Key support sits at $82–$83, with secondary support at $80.50 and $77.20. The demand zone base at $67.73 is described as the floor bulls cannot afford to test.
Solana’s DeFi Gap
One factor weighing on Solana relative to ETH is the state of its DeFi ecosystem. Kamino, the largest DeFi protocol on Solana, holds under $2 billion in total value locked. Ethereum’s Aave alone holds $12.8 billion. Solana has 777 active validator nodes compared to Ethereum’s 912,000.
The meme coin market, a segment where Solana-based platforms like Pump.fun have been dominant, has also softened over the past six months.
Open interest recovery toward $6 billion and stablecoin network volume remain the two key confirmation signals traders are watching heading into the next session.


