






TLDR
- XRP is trading around $1.10–$1.11, consolidating below key resistance at $1.1237–$1.1475
- A symmetrical triangle pattern is forming on the daily chart, with a potential breakout target of $1.35
- Funding rates have turned positive and the 30-day Z-Score has climbed above zero, signaling improving momentum
- RSI sits near 47.85, just below neutral, and the MACD has yet to confirm a bullish crossover
- Key support sits at $1.08–$1.10; a break below $0.93 would weaken the medium-term outlook
XRP is consolidating near $1.10–$1.11 as a symmetrical triangle pattern develops on the daily chart. Analysts are watching whether buyers can push the token above key resistance and toward the $1.35 area.
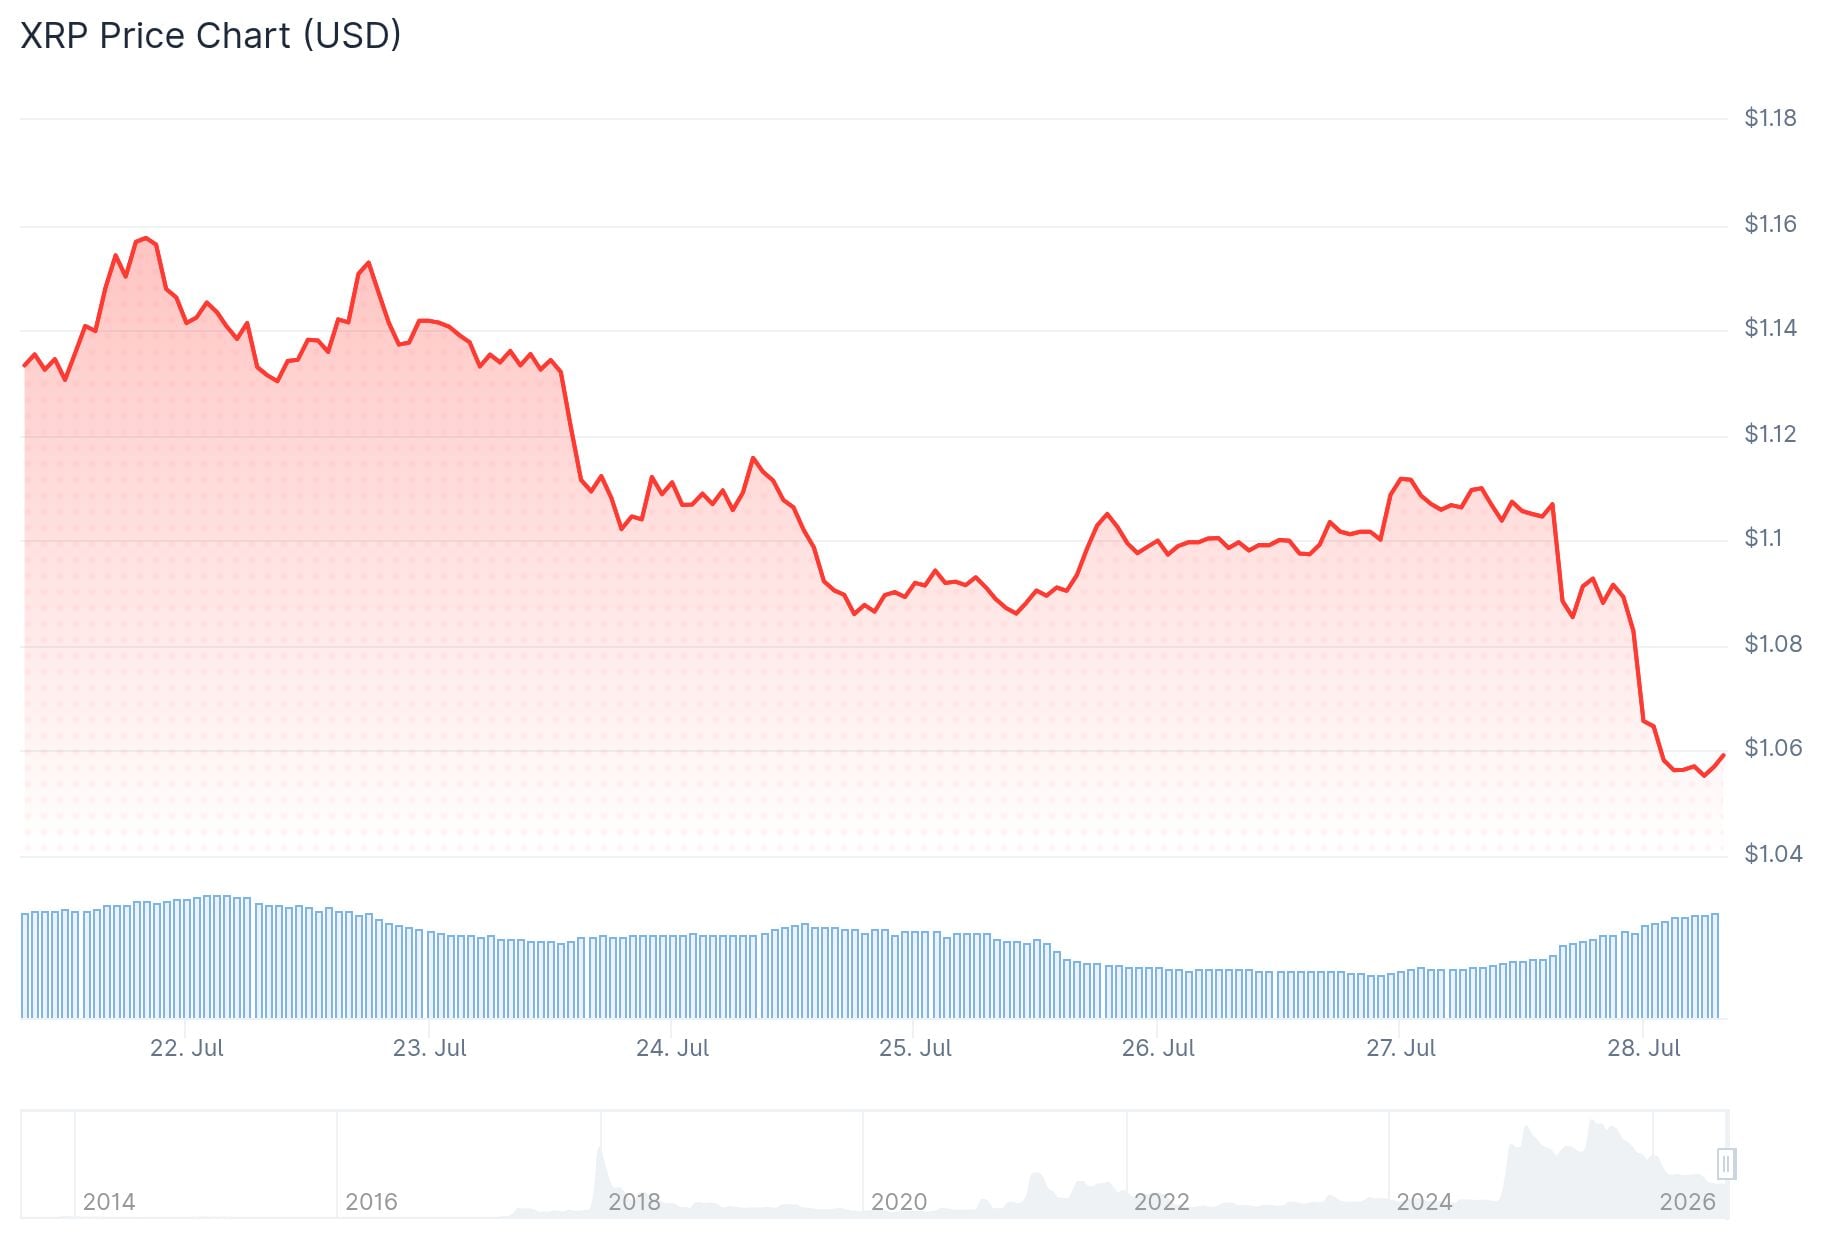
The triangle has formed following a prolonged decline from XRP’s 2025 highs above $3.50. Chart analysis shared by @cryptowithgopal on X shows converging trendlines, with sellers becoming less aggressive and buyers defending progressively higher lows. This points to tightening volatility ahead of a potential resolution.
$XRP$XRP is forming a bullish symmetrical triangle 👀 Price continues to print higher lows while sellers are losing strength, showing momentum is building for a potential breakout.
Buyers are defending support aggressively, and a move above triangle resistance could trigger… pic.twitter.com/dxbiDQGY0g
— Crypto With Gopal (@cryptowithgopal) July 27, 2026
Analyst Crypto Patel highlighted two encouraging technical signals. Funding rates in perpetual futures markets have turned positive, meaning traders are willing to pay a premium to hold long positions. The 30-day Z-Score has also climbed back above zero, indicating XRP is trading above its recent average after a period of consolidation.
$XRP Could Be Entering A Stronger Trend
Funding Rates Are Positive Again And The 30-Day Z-Score Is Above Zero.
The Best Part?
Buyers Are Returning Without Aggressive Leverage.A Healthy Setup Like This Often Comes Before A Bigger Trend Move. pic.twitter.com/k1QqrLxIgw
— Crypto Patel (@CryptoPatel) July 27, 2026
Spot buyers have returned without heavy reliance on leverage. Spot purchases reflect genuine demand rather than borrowed capital, making any resulting rally less prone to sharp liquidation-driven reversals.
Resistance Levels to Watch
The first major hurdle is the 50-day exponential moving average near $1.14. Above that, XRP faces resistance around $1.25, followed by a more important confirmation level at $1.3524.

Analyst readCrypto identifies $1.1237–$1.1475 as a critical zone. XRP needs to reclaim this range and hold it as support to build a case for a new bullish wave. A sustained move above $1.3524 would provide stronger technical evidence that the broader downtrend is reversing.
Market analyst Diana notes XRP has formed a higher low after its latest pullback, and the RSI has recovered to around 47.85–48. The MACD histogram has turned positive, suggesting selling momentum may be easing, though a confirmed bullish crossover has not yet occurred.
Support Levels and Downside Risk
On the downside, the $1.08–$1.10 zone is the key demand area to watch. Holding this level keeps the triangle structure intact.
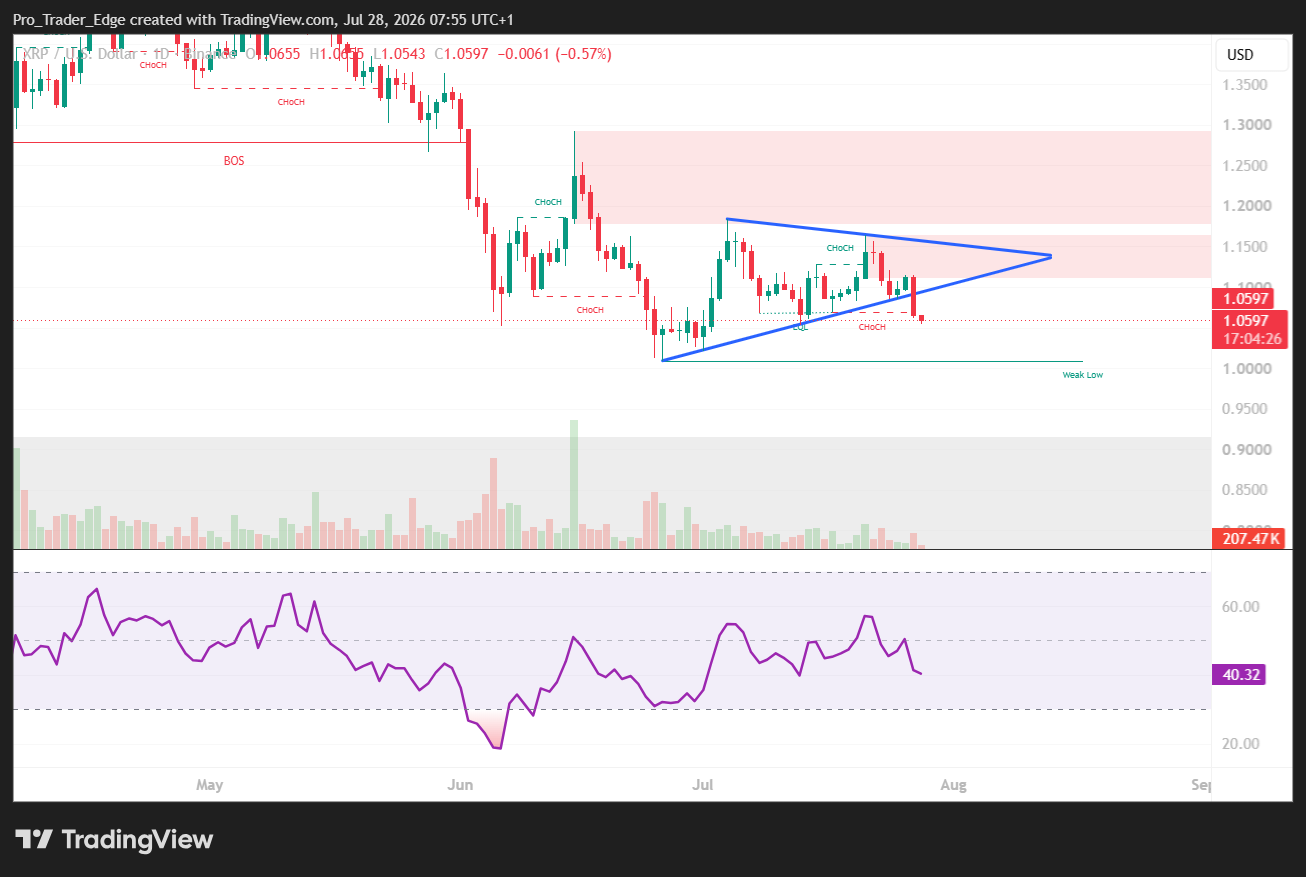
A more significant threshold sits at $0.93. A decisive break below that level could lead to an extended consolidation phase. XRP’s On-Balance Volume has also fallen below its Low Line, making a volume-backed recovery important for any sustainable trend.
Longer-term, XRP faces a volume-profile resistance area between $1.50 and $1.9669, with the 50-week EMA near $1.60 creating another barrier.
XRP has attracted approximately $1 billion in spot ETF inflows and Ripple has continued expanding its global payments network, though the token remains well below its 2025 highs.
The immediate focus remains on whether XRP can reclaim and hold $1.1237–$1.1475 as the triangle pattern approaches resolution.


