


What Are Technical Indicators?
Forming the base of the technical analysis, technical indicators are mathematical calculations used by traders to forecast and confirm short-term price trends of a security. Ignoring fundamental factors typically used to evaluate assets such as revenue and profit, technical indicators solely use historical trading data such as price and volume to determine the likely direction of an asset’s price.
What This Article Will Cover
This article is designed as a concise overview of six of the most used indicators in technical analysis. When used together, technical indicators can provide unique insights into future price movement and market conditions of any asset.
The Six Technical Indicators We’ll Discuss
- Relative Strength Index
- Stochastics Oscillator
- Moving Average Convergence Divergence
- Average Directional Index
- Aroon Oscillator
- On Balance Volume
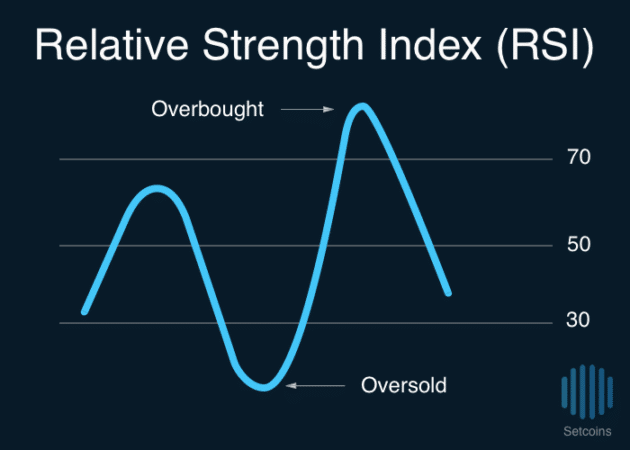
Relative Strength Index
Ranging from 0 to 100, Relative Strength Index (RSI) is a momentum indicator that compares the sizes of recent gains and losses over specified time to measure the price change of a security.
The RSI indicator is mostly used to identify if a security is overbought or oversold. A reading of over 70 means that a security is overbought while a reading below 30 indicates that a security is oversold.

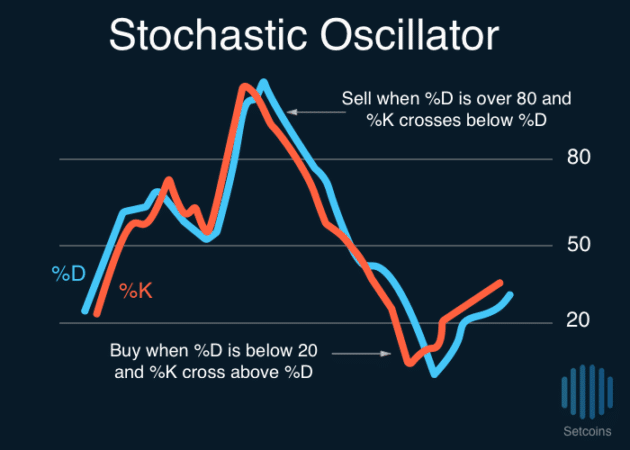
Stochastic Oscillator
The stochastic oscillator is a two-line momentum indicator comparing the closing price of an asset to a range of prices over a specified length of time. The stochastics oscillator normally uses the last 14 days of trading data to calculate its score.
Similar to RSI, the stochastic oscillator ranges from 0 to 100. Readings of over 80 indicate that a security is overbought while readings under 20 indicate that a security is oversold.
The stochastic oscillator is made up of two lines, the %K and the %D. %K measures the momentum of the asset while %D measures the three-day simple moving average of %K. Buy and sell signals are created when the %K line crossovers over %D line.
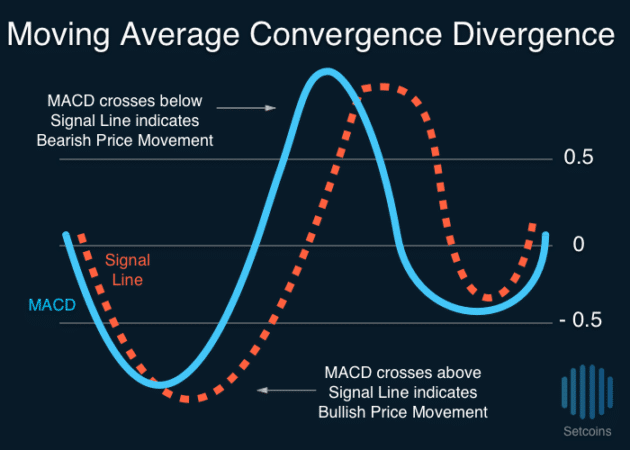
Moving Average Convergence Divergence
The Moving Average Convergence Divergence (MACD) is a popular technical indicator often used to forecast the start of short-term price trends and reversals of an asset. The MACD is calculated subtracting the 26-day exponential moving average from the 12-day exponential moving average for an asset.
When the shorter-term moving average is above the longer term moving average, the MACD becomes positive indicating that momentum is moving upward; likewise, when the shorter-term moving average is below the longer term moving average, the MACD becomes negative indicating that momentum is moving downward.
In addition to the MACD, a “signal line” is plotted on the top of MACD line which help signals buy and sell opportunities. The signal line is simply the nine-day exponential moving average of the MACD Line.
When the MACD crosses below the signal, a bearish signal is created. Likewise, when the MACD crosses above the signal line, a bullish signal is created.
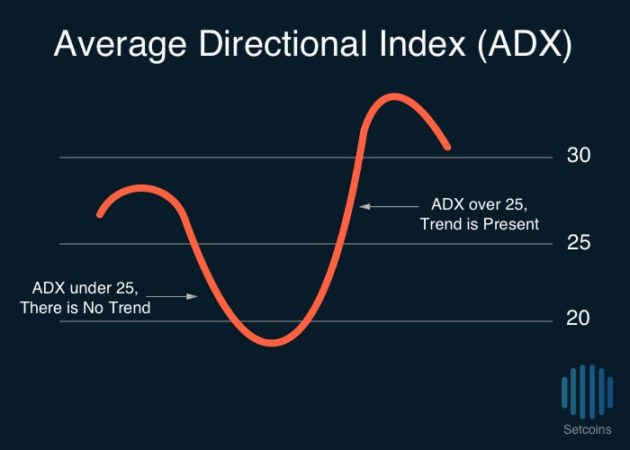
Average Directional Index
Ranging from 0 to 100, the Average Directional Index (ADX) is a technical indicator that signals the overall strength of a price trend. The ADX is a non-directional indicator that can be used it can to qualify the relative strength of either an uptrend or a downtrend.
When the ADX is reading above 25, most traders interpret that as a signal that trend-trading strategies can be implemented. Similarly, when the ADX score is below is 25, investors usually consider that a trend is not present and trend trading strategies should not be used.
| ADX Reading | Strength |
| 0-25 | No Trend |
| 25-50 | Weak Trend |
| 50-75 | Medium Trend |
| 75-100 | Strong Trend |
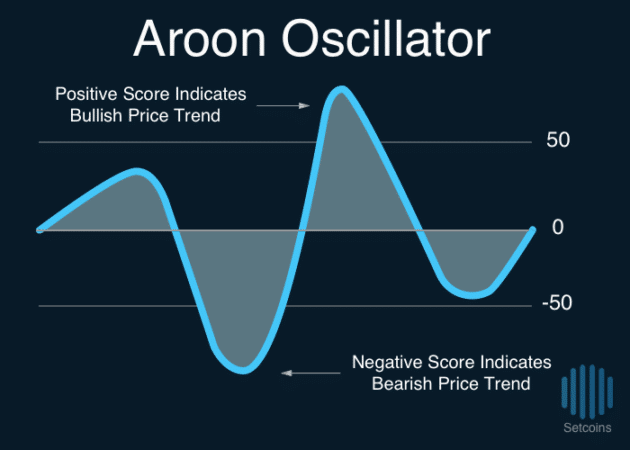
Aroon Oscillator
Ranging from -100 to 100, the Aroon Oscillator is a technical indicator that is often used to forecast when a trend will change directions. Unlike the Average Directional Index that only qualifies the strength of a trend, the Aroon Oscillator signals both the strength and direction of an underlying price trend.
When the Aroon Oscillator is positive, upward momentum price momentum is indicated. Similarly, when the Aroon Oscillator is negative, downward momentum is signaled. The further a reading gets from the centerline at 0, the stronger a price trend is. As Aroon Oscillator approaches and crosses 0 from either direction, the reversal of a price trend may be inferred.
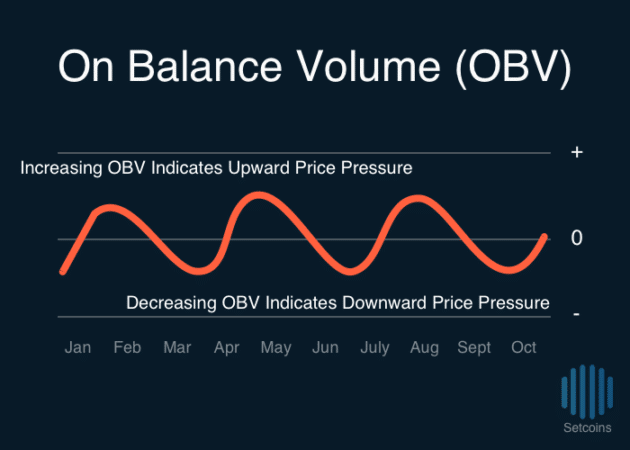
On Balance Volume
On Balance Volume (OBV) is a momentum indicator that uses changes in volume to forecast changes in the price of a stock. Simply defined, On Balance Volume is just an ongoing total of day to day volume change of an asset.
The underlying theory behind using On Balance Volume as an indicator is that dramatic changes in the volume often foretell future price movement of an asset.
If the OBV indicator increases steadily while the price of the asset remains relatively unchanged, investors should expect the price to eventually increase. If the OBV decreases steadily while the price 0f the asset remains relatively unchanged, investors should expect the price to eventually decrease in correlation with volume decrease.
[thrive_leads id=’5219′]
Conclusion
Technical indicators are mathematical calculations that assist investors forecasting short-term price movement of a security. When multiple technical indicators are used together, investors can get a better perspective on the expected price movement and market conditions of an asset.
If you enjoyed this article, check out my other articles on technical analysis.
- Introduction to Technical Analysis
- Introduction to Continuation Chart Patterns
- Introduction to Reversal Chart


