


TLDR
- XRP is trading at $1.12, down 3.11% in 24 hours and 8.91% over the past week
- Analyst Egrag Crypto sees a falling wedge pattern with a breakout needing to clear $1.66–$2.00 before higher targets apply
- Analyst Diana says a move above $1.30 with strong volume would confirm strength toward $1.65
- Ali Charts noted the Tom DeMark Sequential indicator has flashed a buy signal on XRP, suggesting a potential rebound
- Key downside levels to watch are $1.09, $0.90, and $0.86 if buyers fail to hold current support
XRP is locked in a critical support battle at $1.12, with analysts split on whether buyers can hold the line or if further losses are ahead.
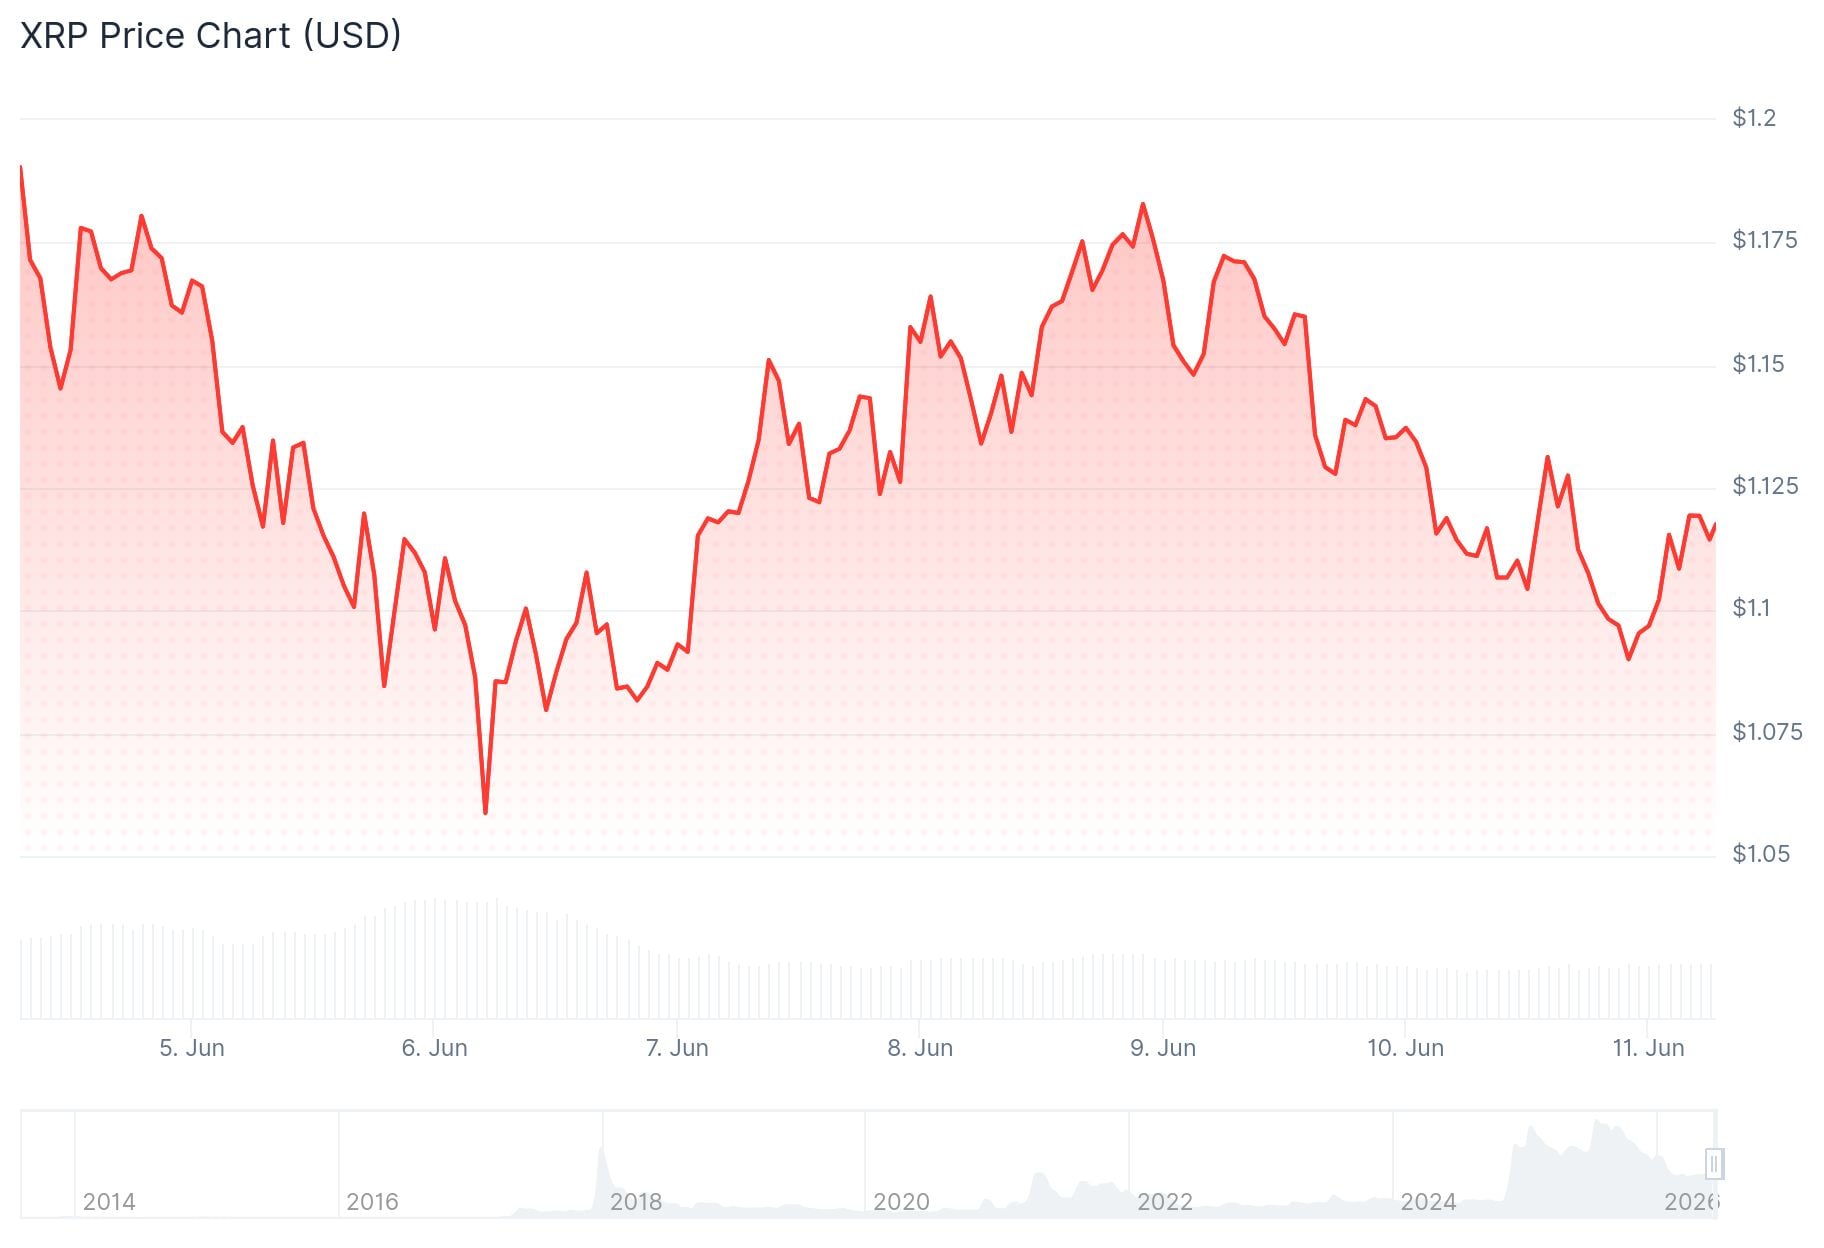
XRP is trading at $1.12 at the time of writing, following a 3.11% drop over the past 24 hours. Volume has also dipped 5.04%, sitting at $1.84 billion. Over the past week, the token has shed 8.91%, according to CoinMarketCap.
The price fell after failing to hold above $1.1550. It dropped through $1.1420 and broke below the 50% Fibonacci retracement of the move from the $1.050 swing low to the $1.1862 high. XRP is now trading below the 100-hourly Simple Moving Average.
On the hourly chart, a bearish trend line has formed with resistance sitting at $1.120. That level is the first hurdle bulls need to clear.
Key Resistance Levels Bulls Must Break
If XRP can push higher, the first major resistance is at $1.1350. A clean move above that could open the door to $1.1420, then $1.1550. The next levels above that are $1.1650 and $1.1840.
Analyst Diana is watching the $1.25 zone closely. She says XRP recovered from macro support at $1.09 and is now testing the $1.20–$1.25 resistance band. She believes XRP needs to stay above $1.12 and break $1.25–$1.30 with volume to confirm strength.
🚨XRP APPROACHING $1.25 DECISION ZONE — BREAKOUT TO $1.65 OR FINAL DROP TO $0.90? 🤯🔥
After bouncing from the $1.09 macro support, $XRP is now attempting to build momentum toward the $1.20-$1.25 resistance area. 👀
✅ BULLISH:
If $XRP HOLDS above $1.12 and breaks through… https://t.co/HIjS19q6Ie pic.twitter.com/MphgsGhVnS
— Diana (@InvestWithD) June 9, 2026

A break above $1.30 would set up a target around $1.65, according to Diana. If that move happens, it would ease pressure from the recent correction.
Analyst Ali Charts posted on X that the Tom DeMark Sequential indicator has flashed a buy signal on XRP, pointing to a potential rebound from current levels.
The Tom DeMark Sequential indicator has flashed a buy signal on $XRP, anticipating a potential rebound. pic.twitter.com/ZABEIx1VIW
— Ali Charts (@alicharts) June 10, 2026
Analyst Egrag Crypto highlighted a macro setup using multiple frameworks — Fibonacci circles, Fibonacci channels, Fibonacci extensions, and a falling wedge pattern. He says XRP is compressing in a key Fibonacci timing window.
#XRP – Macro Confluence Is Building 🎯:
This chart is not about one single tool. It is about confluence.
We have multiple TA frameworks pointing toward the same macro decision zone:
▫️Fib Circles = timing + price rhythm
▫️Fib Channels = expansion path
▫️Fib Extensions = target… pic.twitter.com/DhfwuMzgHZ— EGRAG CRYPTO (@egragcrypto) June 10, 2026
What Happens If Support Breaks
According to Egrag, a confirmed breakout from the wedge needs to reclaim the $1.66–$2.00 range first. From there, he lists upside targets at $8.48, $13.70, $18.06, and $27.68 at various Fibonacci extension levels. These targets are conditional on confirmation.
If the setup fails, Egrag marks $1.21, $0.90, and $0.60 as lower support levels.
On the downside, if XRP fails to hold $1.10, the next major support sits near $1.080 — the 76.4% Fibonacci retracement level. A break below $1.080 opens the door to $1.0650, then $1.050. Below that, $1.020 and $1.00 come into view.
Rejection near $1.25 could keep the broader correction in place, with a drop below $1.09 potentially targeting the $0.90–$0.86 zone.
XRP’s key levels remain $1.09, $1.25, and $1.30. At the time of writing, the price is sitting just above $1.10 support while the hourly trend line caps rallies at $1.120.


