






TLDR
- BNB broke above $700 in August, gaining nearly 18% in one week
- $725 is the key resistance level bulls need to clear for further upside
- Daily RSI is in overbought territory, above 70–80 on most readings
- Elliott Wave analysis projects a potential Wave B recovery between $780 and $1,190
- Analyst Rand Group noted that a monthly close above $670 would be a bullish signal
BNB climbed from around $590 in mid-August to above $700 within days, one of its sharpest recoveries this year. CoinGecko data shows the token closed at $707.48 on August 26, with CoinLore placing the August 27 close at $712.16 after an intraday high of $714.88.
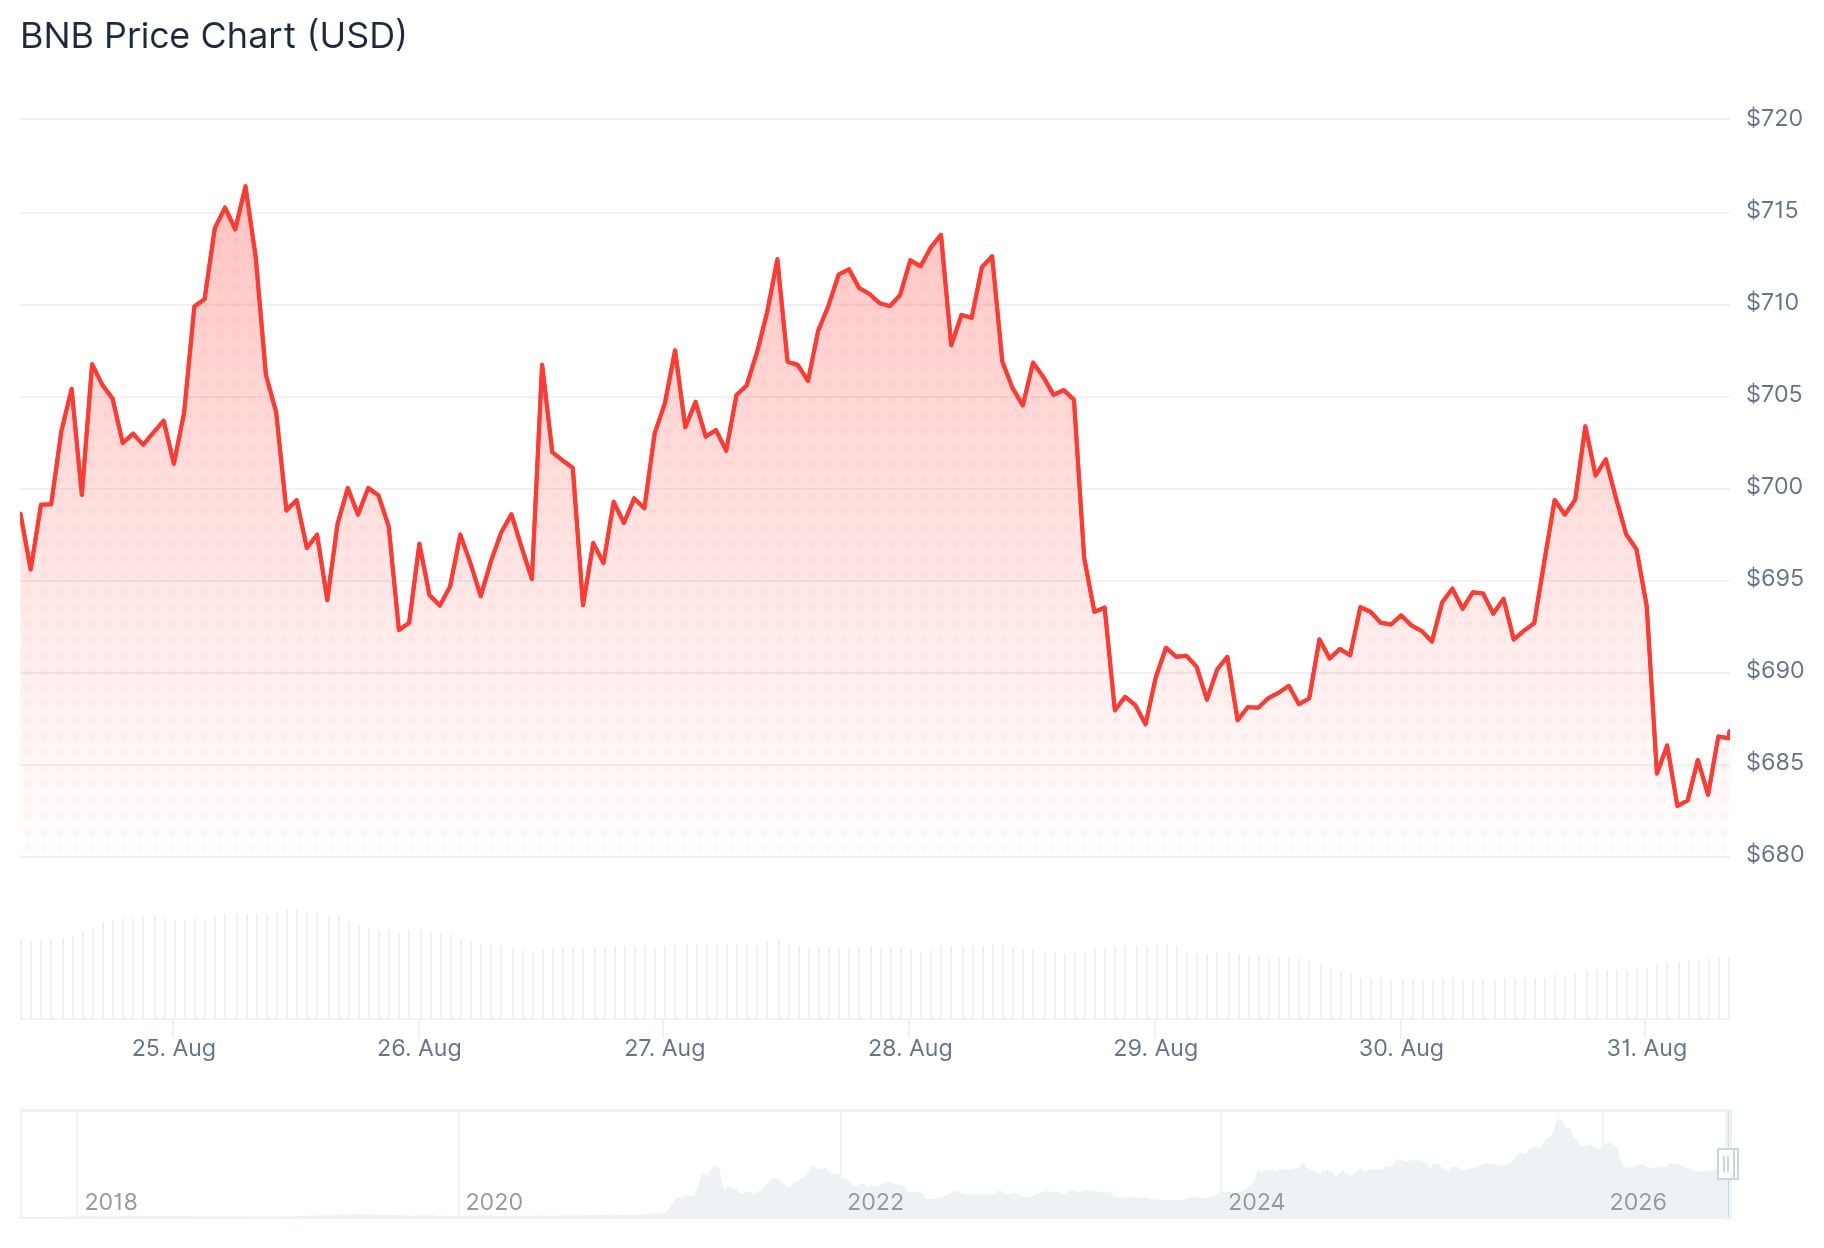
The rally pushed BNB’s market cap back toward the $94 billion area. The token is still below its all-time high of $1,373.40, leaving roughly 92% upside to that level from current prices.
The move came as broader market sentiment turned bullish. Big money positioning flipped to “extremely bullish” on August 25, the first such reading this cycle, according to Benzinga. Bitcoin was pushing $80,000 and the Fear and Greed Index hit its highest reading since January.
Volume carried BNB through seven weeks of resistance in a single session. Crypto analyst Bitcoin Professor noted the 18% weekly gain and flagged $710–$725 as the critical resistance zone. He stated that a clean breakout above $725 could accelerate bullish momentum, while $690–$695 needs to hold to keep the structure intact.
Crypto analyst Rand Group posted on X that a consolidation above the $670 range on the monthly close would be “extremely bullish” for BNB. The comment came as the token pushed through that level and held above it, a development the analyst had identified as a key trigger for further gains.
Amazing $BNB push here, consolidation over the $670 range on the monthly close would be extremely bullish pic.twitter.com/KDzjrTP9pF
— Rand Group (@randgroup) August 27, 2026
RSI Signals Caution at Resistance
BNB’s daily RSI has moved into the upper 70s and, on some data feeds, above 80. Stochastic readings, the Commodity Channel Index, and Williams %R are all stretched. MACD remains positive, meaning the broader momentum structure has not broken down.

The overbought readings do not guarantee a reversal, but they do suggest consolidation is possible if buyers cannot push through $725.
Elliott Wave Projects $1,190
Chart analyst @finsends argues that BNB may have completed an A-wave bottom within a larger corrective structure. The analyst projected a 20–70% advance before another corrective leg, placing a potential Wave B recovery between $780 and $1,190.
$BNB: Third biggest coin and nobody talks about it#BNB has a unique structure. It should have bottomed, but not in a second wave but rather an A of a bigger correction.
Still, 20-70% is realistic before the next leg down starts.Worth buying or enter a smaller coin?🤔 pic.twitter.com/fxwHEjQ6ZB
— V (@finsends) August 27, 2026
A move above $1,400 would provide stronger confirmation of a higher-degree Wave 3 scenario, according to the same analysis. Some analysts have $984 on the board as a December target.
BNB is currently trading above its 20-, 50-, 100-, and 200-day moving averages. The 50-day SMA sits near $603 and the 200-day near $617, both well below the current price.
The next key levels to watch are $725 to the upside and $690–$695 as the nearest support below.


