






TLDR
- Analyst Ali Charts says a triangle breakout on the 12-hour chart could push ETH to $3,000
- Ethereum ETFs pulled in $216.41 million in net inflows on September 11, led by BlackRock’s ETHA at $148.82 million
- ETH broke above the $2,300–$2,400 resistance zone, which analysts now watch as key support
- MACD momentum is weakening, with ETH trading near $2,478 and RSI at 51.77
- A drop below $2,490 could open the door to the $2,400 support level
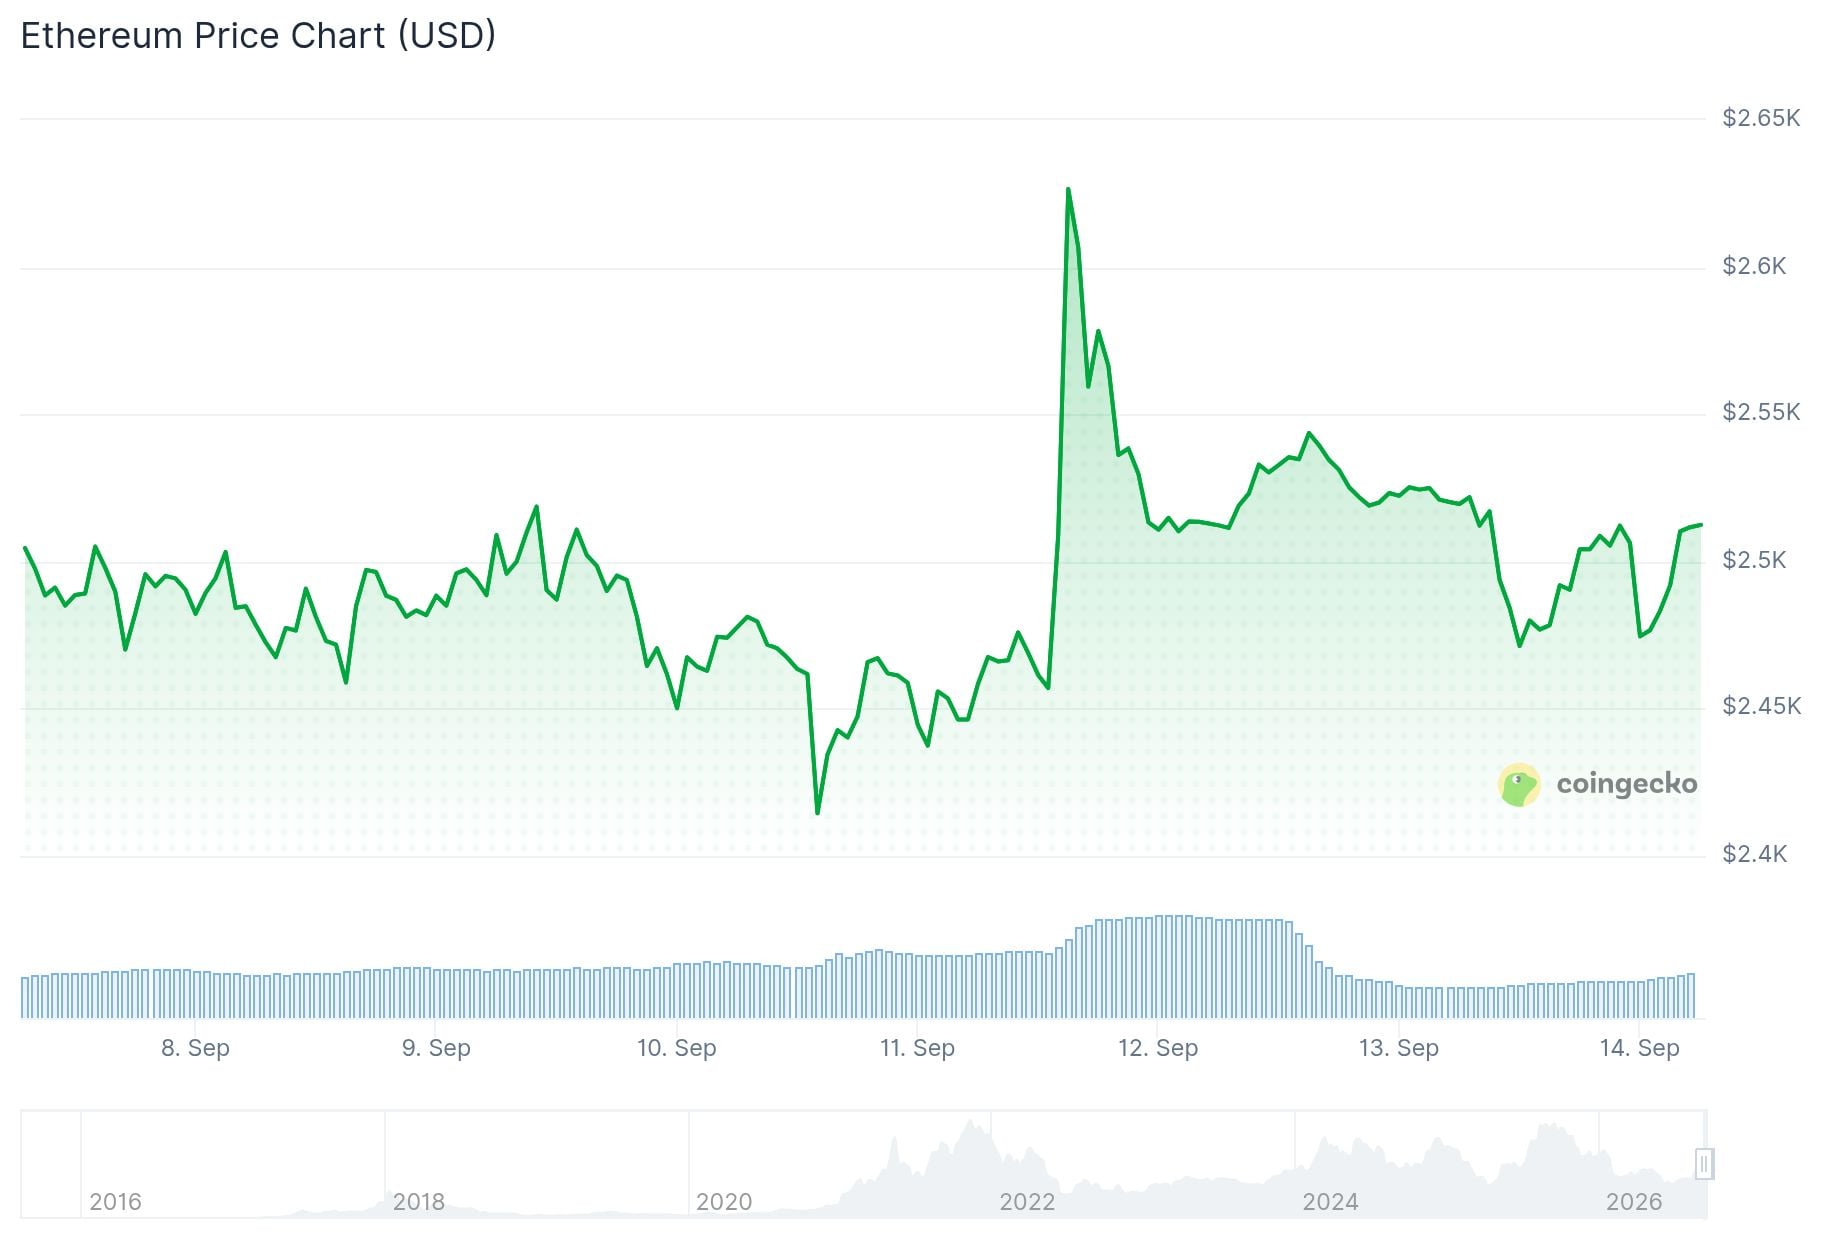
Ethereum is trading near $2,478 as analysts watch a developing chart pattern that could point toward a $3,000 price target. The crypto market is also keeping an eye on the Federal Reserve meeting scheduled for September 15–16, which could shift expectations around interest rates and risk assets.
Analyst Ali Charts flagged a triangle forming on ETH’s 12-hour chart. The last time a similar triangle broke out, Ethereum surged 31% in just three days. Ali Charts posted on X: “The last triangle breakout sent Ethereum surging 31% in just three days. Now, another triangle is forming. If $ETH breaks out again, a similar move could send it to $3,000.” This is a possibility, not a guaranteed price target.
ETHEREUM TARGETS $3,000
The last triangle breakout sent Ethereum surging 31% in just three days.
Now, another triangle is forming.
If $ETH breaks out again, a similar move could send it to $3,000. https://t.co/BXa3sGjPMf pic.twitter.com/E4zlJHNFNc
— Ali Charts (@alicharts) September 13, 2026
A separate analyst, Wealthmanager, pointed out on September 13 that Ethereum has already cleared its higher time-frame resistance at $2,300–$2,400, something Bitcoin has not done at its own resistance zone of $82,000–$83,000. Wealthmanager sees ETH reaching $3,000 before potentially pulling back to the $2,300 area.
ETF Inflows Show Strong Institutional Interest
On September 11, Ethereum ETFs recorded net inflows of $216.41 million. BlackRock’s ETHA led all funds with $148.82 million in daily inflows. Bitwise’s ETHW brought in $29.09 million, BlackRock’s ETHB added $18.32 million, and Fidelity’s FETH contributed $11.40 million.
Source: https://t.co/YcNXWVZGwE
— Wu Blockchain (@WuBlockchain) September 12, 2026
Grayscale’s ETH fund drew $5.09 million, and VanEck’s ETHV received $3.71 million. Grayscale ETHE and Franklin EZET recorded no new inflows. Total historical inflows now sit at $13.39 billion, with net assets at $16.31 billion — representing 5.28% of Ethereum’s total market cap. Trading volume on September 11 reached $2.56 billion.

Technical Levels to Watch
Analyst Daan Crypto Trades noted that ETH has pulled back toward its breakout zone following the recent price move. He highlighted that open interest in perpetual futures had been reduced, which may relieve some leverage pressure from the market.
$ETH All the way back to the breakout level of its recent pump.
A lot of that move was perp driven of which most open interest has now been washed back out. pic.twitter.com/eQr7S8Uqf4
— Daan Crypto Trades (@DaanCrypto) September 13, 2026
ETH is currently hovering near the mid Bollinger Band at $2,470. The upper band sits at $2,543 and the lower at $2,396. The MACD line at 81.68 is below its signal line of 99.69, with a histogram reading of -18.01, suggesting weakening momentum.
The RSI on the four-hour chart stands at 51.77, just above the neutral 50 level. A move above $2,550 would bring the recent $2,600 high back into focus. ETH’s next major support below current price is the $2,400 level.


